
The Charts Below Provide the Primary Reason Tourists Visited Orange City in Two Different Years. Summarize the Information by Selecting and Reporting the Main Features, and Make Comparisons Where Relevant.
 Sample 1: The Charts Below Provide the Primary Reason Tourists Visited Orange City in Two Different Years
The two pie charts illustrate the main reasons why tourists visited Orange City in the years 2006 and 2016. It is evident that there were significant shifts in visitor preferences over the decade.
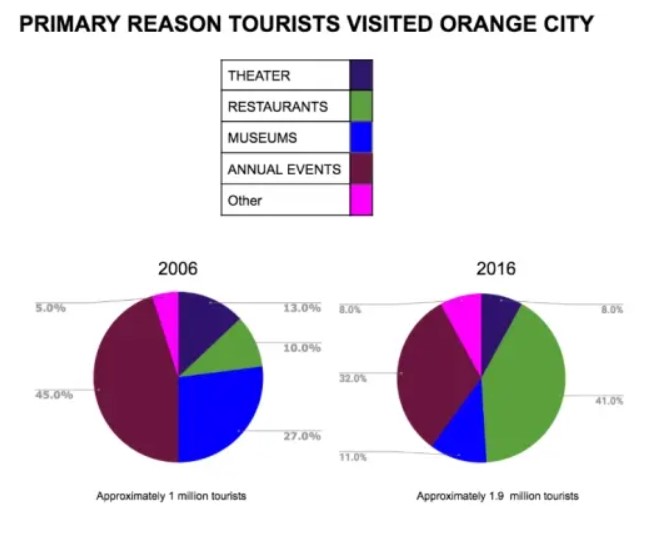
In 2006, the majority of tourists (45%) came to attend annual events, making it the dominant reason for visiting the city. Museums were the second most popular attraction, drawing 27% of tourists, followed by theatre at 13%. Only 10% came for the restaurants, while the remaining 5% visited for other reasons.
By 2016, however, the picture had changed noticeably. The proportion of tourists attending annual events dropped sharply to 32%, while the percentage visiting for restaurants surged to 41%, making it the most popular reason that year. Theatre visits declined to 8%, and museum visits also decreased slightly to 11%. The ‘other’ category saw a modest increase to 8%.
Overall, while cultural attractions such as museums and theatre saw declines in popularity, culinary tourism experienced a significant rise. This shift suggests changing tourist interests over the decade, possibly influenced by an evolving urban culture or improved culinary offerings in Orange City.
Sample 2: The Charts Below Provide the Primary Reason Tourists Visited Orange City in Two Different Years
The two pie charts illustrate the primary motivations of tourists visiting Orange City in the years 2006 and 2016. The data reveals a clear shift in visitor interests over the decade, with a notable rise in culinary tourism and a relative decline in traditional cultural attractions.
In 2006, the most dominant reason for visiting was to attend annual events, accounting for 45% of all tourist visits. Museums were also a major attraction, drawing 27% of visitors, followed by theatre performances at 13%. Restaurants were less significant at that time, attracting only 10% of tourists, while the remaining 5% visited for other reasons.
A decade later, by 2016, the landscape had changed dramatically. Restaurants had emerged as the leading reason for visits, attracting 41% of tourists—quadrupling their share compared to 2006. Meanwhile, the appeal of annual events had diminished, falling to 32%. Museums and theatre both experienced noticeable drops in popularity, decreasing to 11% and 8%, respectively. The percentage of tourists visiting for other reasons increased slightly to 8%.
In terms of absolute numbers, the total tourist count nearly doubled from 1 million to 1.9 million, suggesting growing interest in the city overall. However, the data indicates that tourist preferences became more experience-oriented, with food becoming a central driver for travel decisions.
In summary, while traditional cultural attractions like museums and theatres saw reduced interest, Orange City witnessed a culinary boom, marking a shift in the tourism sector towards gastronomic experiences. This trend may reflect global changes in travel behavior where tourists seek more immersive and sensory-based experiences.
Follow Us on The IELTSFever Facebook Page for more updates
Discover more from IELTS Fever
Subscribe to get the latest posts sent to your email.