


The chart shows the components of GDP in the UK from 1992 to 2000. Summarize the information by selecting and reporting the main features and make comparisons where relevant.
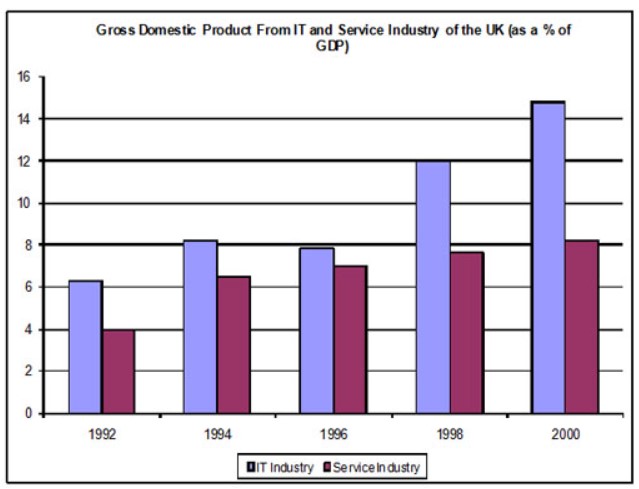

The given bar graph illustrates the gross domestic product from two industries which were the IT industry and the service industry in the UK among the year 1992 to 2000
Overall, it can be noted that in all years, the IT industry’s GDP was higher than the service industry as well as increased each year.
In 1992, to begin with, a 6.1% GDP was noted in the IT industry, which increased by 2% in 1994. while in this industry, there was a mere 0.5% GDP decrease in another two years. After that, it picked up dramatically in 1998 and touched 12% GDP.in the next two years it also increased significantly and touched 12% GDP, which was the highest rise of all years in both industries and more than doubled by 1992.
In the service industry, there was 4% GDP noted in 1992, which increased in 1994 and reached 6 %.it can be noted that in the years 1996 and 1998, it rose marginally. Lastly, in 2000 there was 8% GDP noted in this industry which was less than double of the IT industry in a similar year.
Sample 2 The Chart Shows the Components of Gdp in The Uk from 1992 to 2000
The chart depicts the Gross Domestic Product (GDP) from the IT and Service industry from the year 1992 to 2000 in the United Kingdom.
Overall, GDP from the IT sector remained higher than the Service industry from 1992 to 2000. Initially, the difference between both sectors was limited; however, in later years, the difference was much more than in the past.
In 1992, GDP from IT was around 6%, whereas, from the service sector, it was 4%. In 1994, in the IT sector, it raised nearly 8%, and in the service industry, it reached above 6%. In the year 1996, there was a minimal difference in the GDP from both industries (both were between 6 to 8%).
From 1998, the difference between both sectors in terms of GDP became more noticeable and continued in the year 2000. In 1998, the GDP of the IT industry was 12%, just a little less than 8% for the service sector. In 2000, the IT sector’s GDP rose more than 14% whilst for the Service sector it remained near 8% only.
Follow Us on IELTSFever Twitter for more updates