The Chart Shows the GDP Components in the UK from 1992 to 2000. Summarise the Information by Selecting and Reporting the Main Features and making comparisons Where Relevant.
 Sample Answer: The Chart Shows the Gdp Components in The Uk from 1992 to 2000
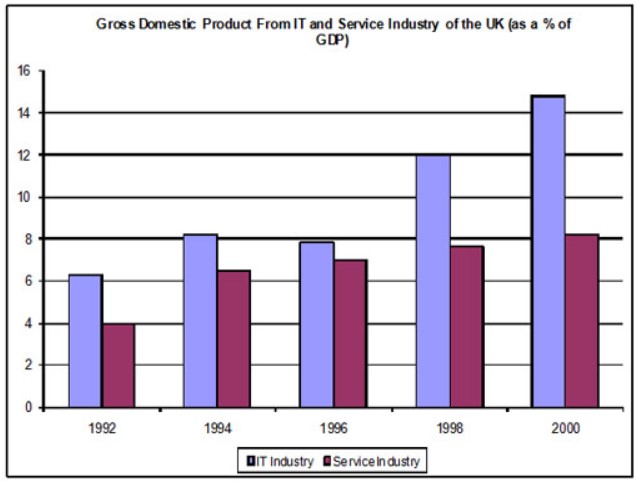
The bar chart illustrates the contribution of the Information Technology (IT) and Service industries to the United Kingdom’s Gross Domestic Product (GDP) between 1992 and 2000, expressed as a percentage of total GDP.
Overall, it is evident that both sectors experienced growth over the given period, with the IT industry showing a much sharper and more consistent increase than the service industry.
In 1992, the IT sector accounted for around 6% of the UK’s GDP, whereas the service industry contributed only about 4%. Over the next two years, both sectors rose, but the IT industry remained dominant at 8%, compared to roughly 6.5% for services.
By 1996, growth in both industries was steady, reaching approximately 8% and 7%, respectively. However, from 1998 onward, the IT sector’s contribution rose significantly, reaching about 12% in 1998 and peaking at 14% by 2000. In contrast, the service industry grew more modestly during the same period, rising slightly from 7.5% to around 8%.
Overall, the IT industry’s contribution to GDP nearly doubled over the eight years, showing its growing importance in the UK economy. Meanwhile, the service industry also expanded, but at a slower pace and with a much smaller overall share compared to IT.
Follow Us on The IELTSFever Facebook Page for more Updates
Discover more from IELTS Fever
Subscribe to get the latest posts sent to your email.