Write at least 150 words
Answer
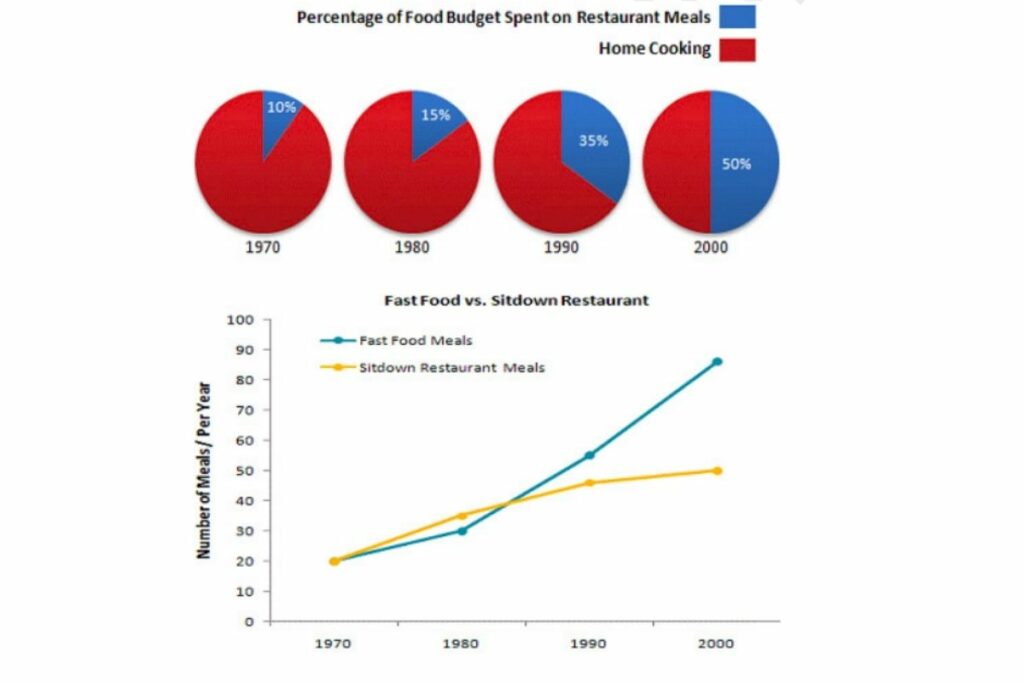
The multiple pie charts illustrate the percentage of food budget spent on restaurants by an average family in the years ranging from 1970 to 2000. Another line graph compares the number of meals consumed in fast-food and sit-down restaurants over the same time span.
Steady growth in the percentage of food budget spent on restaurant meals can be observed over the years. Starting from a mere 10% in 1970 and reaching a high of 50% in 2000.
Coming to the number of meals consumed per year in fast-food restaurants, a slight growth from 20 to 30 meals/year between 1970 and 1980. And a rapid escalation from 1980 to 2000, reaching 90 meals/year is vividly noticeable. However, in sit-down restaurants, a gradual increase in the slope from 20 to 50 meals/day from 1970 to 2000 is evident.
Overall, one can say that over the years, fast-food has gained a lot of popularity among most people.
So this is the end of the Academic Writing Task 1 (The charts below show the percentage of food budget the average family spent on restaurant meals in different years. The graph shows the number of meals eaten in fast-food restaurants and sit-down restaurants.)
Discover more from IELTS Fever
Subscribe to get the latest posts sent to your email.