


The diagram below shows the average hours of unpaid work per week done by people in different categories. (Unpaid work refers to such activities as childcare in the home, housework and gardening.) Describe the information presented below, comparing results for men and women in the categories shown. Suggest reasons for what you see.
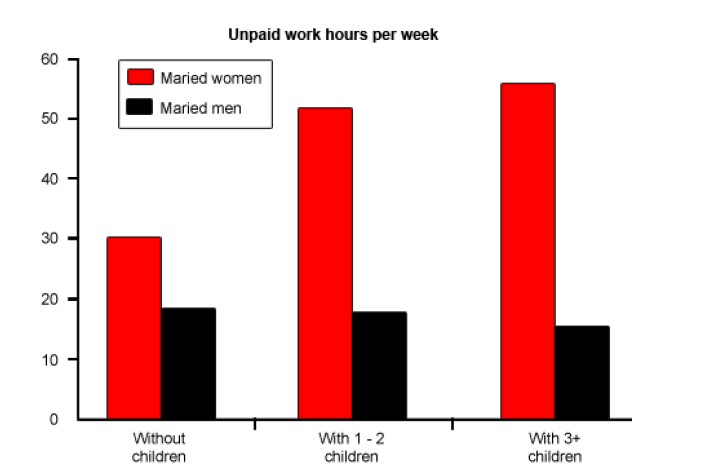

The given bar graph illustrates the average hours spent by the married men and women for their unpaid work in one week. Overall it can be observed from the bar graph that women work more than men in a week.
By comparing the information presented below, it is visible that women with children work more hours than women with no children. Women with more than three kids work nearly 55 hours, and women with one to two kids work for 50 hours. However, women with no children work only for 30 hours.
In contrast, men with Fewer kids and men with no children work for more hours, which is nearly an average of 19 hours. Meanwhile, men who have more than three children work a little bit less than the others, that is for 17 hours. The main reason behind this is that men prefer to do paid work for their family whereas most of the women are homemakers after their marriage.
Follow Us on IELTSFever Twitter for more updates