The Figure Shows Demographic Trends in Scotland. Summarise the Information by Selecting and Reporting the Main Feature.
Sample Answer: The figure shows demographic trends in Scotland. Summarise the information by selecting and reporting the main feature.
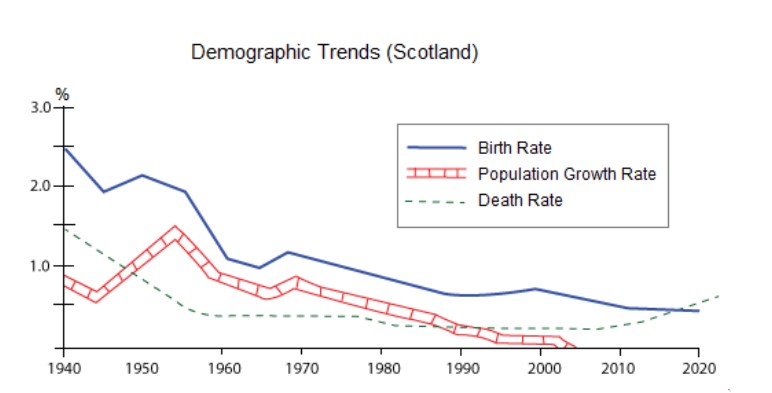
The given line graph illustrates the information related to the percentage of the population in Scotland’s birth rate, growth rate, and death rate over an eight-year period, between 1940 and 2020.
Overall, the line chart reveals that, in all three categories of population measurement, measurement decreased significantly.
At first, in 1940, the rate of newborn babies was exactly 2.5%, which was 1% higher than the death rate, and population growth was around 0.9% in Scotland. However, expect population growth (1.5%); the other two declined to 1% in 1960. Moreover, between 1960 and 1990, the numbers fluctuated in all three categories and stopped at around 0.4% for the death rate, 0.5% for population growth, and 1% for the birth rate.
After the next decade, population growth and death rates equalled approximately 0.4%, while birth rates slightly decreased to under 1%. Between 2000 and 2010, population growth was 0%, while the other two variables were slightly altered. At the end of the period, the death rate (more than 0.5%) crossed the birth rate (under 0.5%).
Follow Us On IELTSFever Facebook Page For More Updates
Discover more from IELTS Fever
Subscribe to get the latest posts sent to your email.


