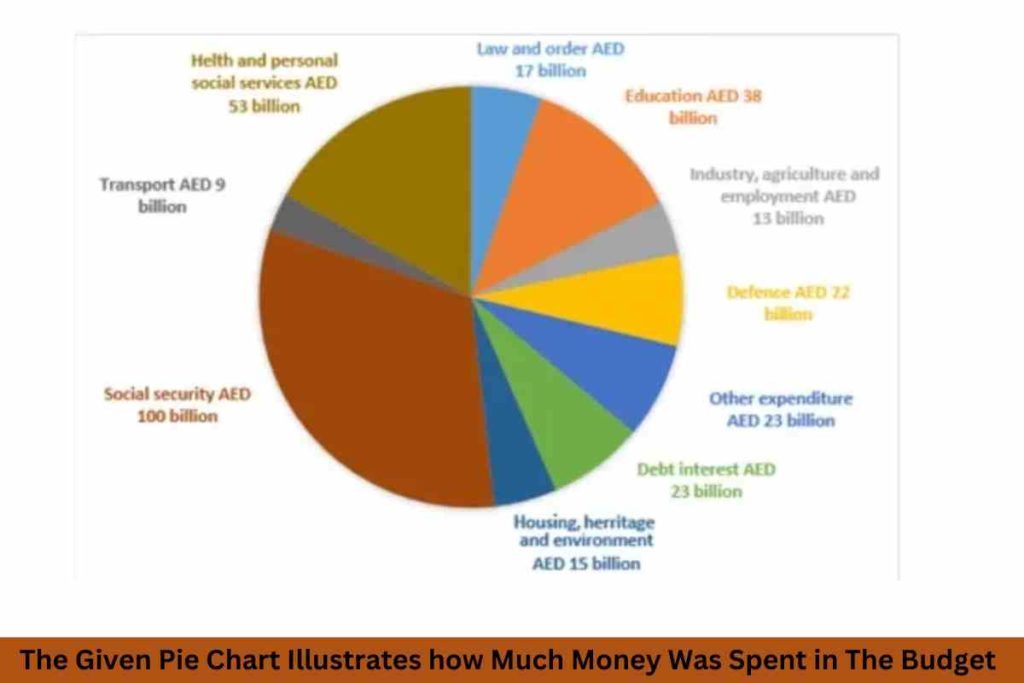
The par chart gives information about the amount of money spent on various sectors by the government of UAE in the year 2010.
Overall, the country’s budget had significantly a large proportion to three divisions. These are health and personal social services AED, Social security AED, and education AED. While the highest interest in social security government, hence, other sectors were slightly spent money.
First of all, the three sectors in UAE consumed over half of finance during this period. The country invested 100 billion AED on social security, and the second highest portion went to health and personal social service, about 53 billion AED, furthermore, education spent about 38 billion, respectively.
However, the other sectors had remained nearly less than half of the majority total spent in 2010. The tiny fraction the country had spent on transport was approximately 9 billion in this interval. Both (industry, agriculture, and employment) and (Law and order )and (Housing, heritage, and environment) have the same percentage. Another expenditure was around 23 AED, similar to debt interest.

