
The Graph Above Shows Information About Employment Rates Across 6 Countries in 1995 and 2005. Summarize the Information by Choosing and Describing the Main Idea and Make Comparisons Where Appropriate.
 Sample 1: The Graph Above Shows Information About Employment Rates Across 6 Countries
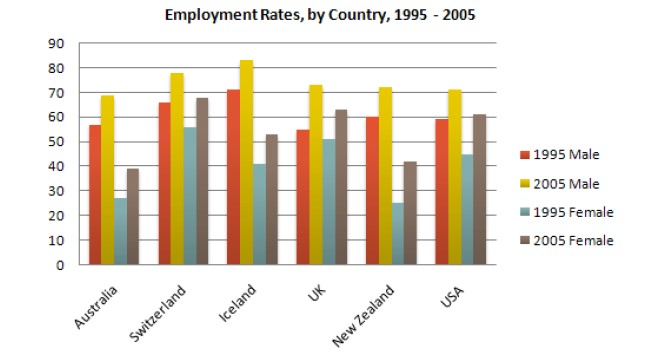
The given bar chart illustrates the information related to the percentage of employed males and females in six different nations (Australia, Switzerland, Iceland, the UK, New Zealand, and the USA) over two dissimilar years (1995 and 2005).
Overall, the bar chart reveals that employment among men was higher than that of women in both years. Another interesting fact is that employment for both genders went up during the given period.
At first, in 1995, only Iceland had more than 70% of jobs for men, and Switzerland’s males had 60%, while in the other four countries, male employment was under 60%. As for the women’s case, Switzerland’s females had the highest engagement, which was about 55%, and Iceland, the UK, and the USA’s women’s employment was between 40 and 50%.
Moreover, in 2005, for male employment, every nation crossed 70%, and Iceland crossed 80%, but only Australia had under 60% of male employment. In women’s criteria, ranking remained the same, and every Country jumped 10% in women’s employment.
Sample 2: The Graph Above Shows Information About Employment Rates Across 6 Countries
The bar chart illustrates data on the recruitment rate among six nations between 1995 and 2005.
Generally, the percentage of recruited men in 1995 and 2005 was the highest in the respective years, with more males employed in 2005 in all the nations. However, in Britain, Switzerland, and America, the number of women working in 2005 was slightly above the number of men in 1995 while ladies employed in 1995 had the lowest percentage.
In 1995, the employment rate for men in Australia was around 58%, which rose to about 68% in Switzerland and approximately 71% in Iceland and dropped to almost 55% in the UK while increasing to 59% in America. Nevertheless, in 2005, the recruitment of men observed fluctuations in these six territories, with Iceland having the highest number of male employees with a percentage of about 82%, followed by 78%, 72%, 71%, 70%, and 69% in Switzerland, UK, New Zealand, USA, and Australia respectively. In 2005, the rate of working-class women was slightly above the number of working men in Britain, Switzerland and America in 1995.
The number of ladies that worked in 1995 remained the lowest in all the nations with about 28% in Australia, 57% in Switzerland, 40% in Iceland, 50% in the UK, the lowest in New Zealand at around 25% and approximately 45% in the USA.
Discover more from IELTS Fever
Subscribe to get the latest posts sent to your email.


