

The graph below shows the number of hours per day on average that children spent watching television between 1950 and 2010. Summaries the information by selecting and reporting the main features, and making comparisons where relevant.
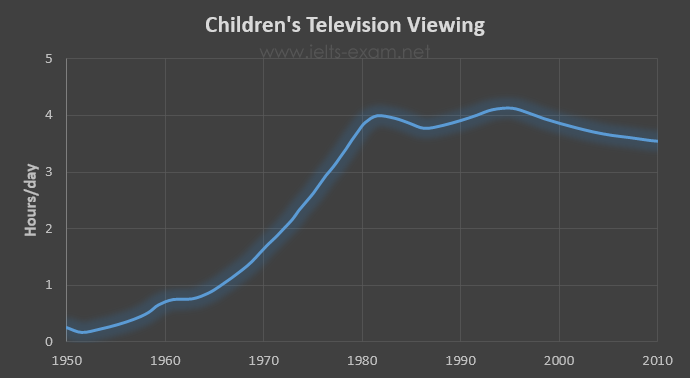

The render bar chart enumerates how many average hours children spend watching television per day from 1950 to 2010.
Overall, it is crystal clear that in the starting time period watching TV hours was the least although, it rose year by year.
In 1950, per day watching television hours for children was under a half-hour, it surged later, and it took 15 years to reach 1 hour per day. After 1965, viewing television became common for children; thus, hours grew dramatically. Between 1965 and 1980, it was from 1 hour per day to 4 hours per day which was fourfold that it was three decades ago.
Hours of watching TV remain same in 1980 and in 1990 but, between that, it touched dip point on account of 3 hours and 45 minutes roughly. It declined slightly by a half-hour in the next two decades. However, in 1992, viewing hours was on the zenith, over 4 hours.
Follow Us on IELTSFever Twitter for more updates
Also Read Some People Think that If a Country Is Already Rich, Any Addition in Economic Wealth