
Sample Answer:-The Graph Below Shows the Number of Hours per Day
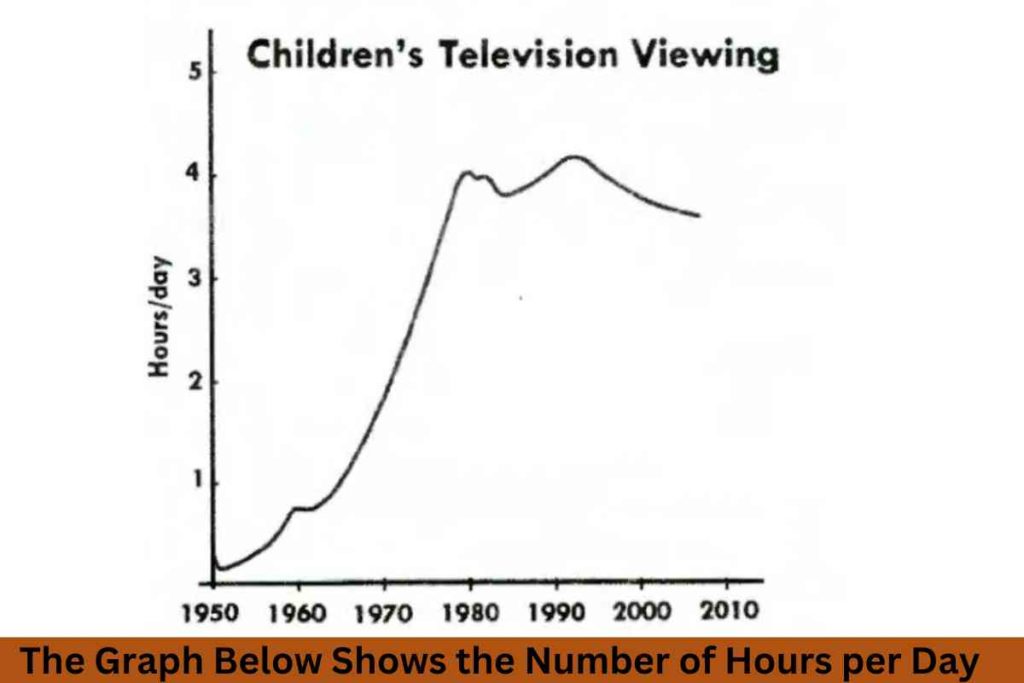
The graph illustrates the average number of hours children spent watching television per day from 1950 to 2010.
Overall, as the years progressed from the start of 1950, there was a steady increase in hours of watching television, although it dropped low at the end of the year.
From 1950 to 1960, kids spent an average of less than one hour daily; as the years progressed into the seventies, it became 2 hours daily. In the mid of seventies till 1980 the children’s view skyrocketed to 4 hours per day. However, in the early nineties, there was a minimal decline of less than 4 hours.
While during the period of 1990 to 2000, the years had small variations of four hours and some minutes more. From the mid of 2000 to 2010, the children had a reduced screen time of less than 4 hours.
![]()
Discover more from IELTS Fever
Subscribe to get the latest posts sent to your email.


