


The Graph shows the information on smoking frequently seen among athletes of Parkview secondary school. Summarize the information by selecting and reporting the main features, and make comparisons where relevant. You should write at least 150 words.
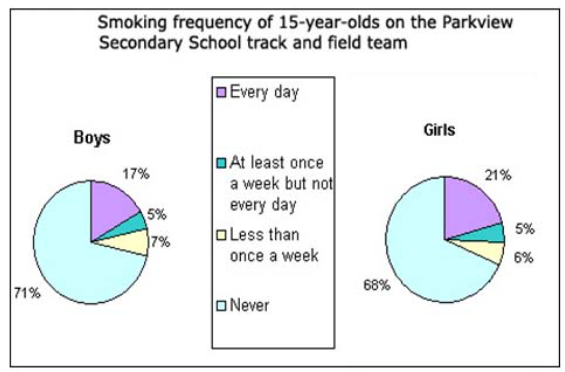

The yielded two pie charts demonstrate 15 years old athletes smoking habits frequently at the Parkview secondary school.
Overall, we can clearly see that non-smokers proportion is higher in boys group than girls additionally, the least percentage is never smoking in both groups.
For Boys, 17% of students have an everyday smoking habit whereas, with the highest percentage, 71% of pupils avoid smoking or never smoke. Furthermore, not every day but once a week and less than once a week learners proportion is 5% and 7% respectively.
For Girls, just above one in the fifth percentile of female learners are smoking regularly or every single day. Never smoker percentage is also higher than others, although it is only 2% less than boys; however, for once a week but not every day, the smoking habit proportion was identical to boys. Moreover, a female who smoked less than once a week has 6%.
Follow Us on IELTSFever Instagram for more updates and the latest test tasks.
Also, Read The Chart Below Shows the Global Sales