
The chart below shows the global sales (in billion dollars) of different kind of digital games from 2000 to 2006. Summarise the information by selecting and reporting the main features, and make comparisons where relevant.
Sample Answer of The Chart Below Shows the Global Sales
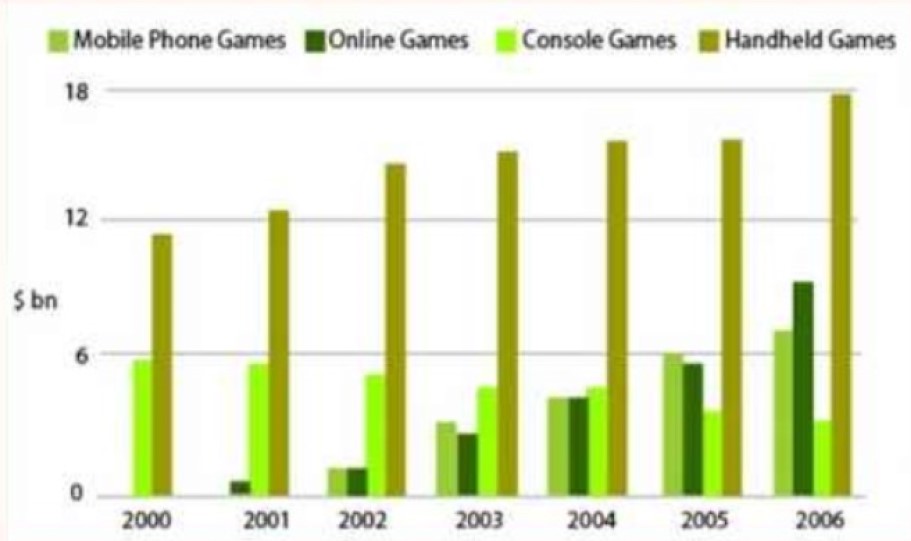
The bar graph depicts the worldwide sale of diverse kind of computer games between 2000 and 2006.
In 2001, almost 1 per cent billion dollars sales were noticed on real-time entertainment, which later increased with time. But still, it was less than 6 billion dollars sales until 2005. Whereas, a fluctuation has been seen in the sales of video games in seven years. Moreover, it never crosses the sales up to 6 billion dollars. In 2006 sales of online games cross more than 6 billion dollars.
From the year 2002, a drastic surge has been noticed in mobile phone activities’ sales, which increased by almost 1 billion dollars every year. On the other hand, sales of ordinary games were almost 11 billion dollars in the year 2000. And it crosses up to 12 billion in the next year; after that, a slight increase has been noticed in the sales of family games. Which was a peek in the year of 2006, which was almost more than 17 billion. Overall, Sales of multiplayer was decreased every year, which is not negligible. Whereas, Sales of homely games was always observed at peek every year.
Discover more from IELTS Fever
Subscribe to get the latest posts sent to your email.


