


The graph shows the number of books read by men and women at Burnaby Public Library from 2011 to 2014.
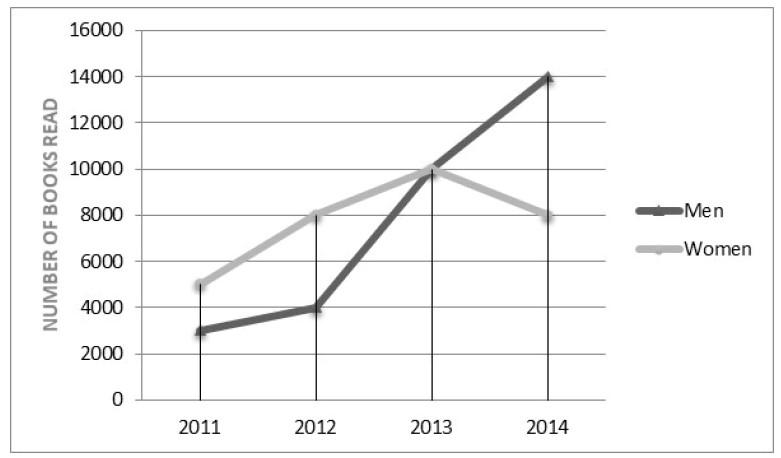

The line graph illustrates the data of books read by men and women at Burnaby Public Library over a 3years period,2011 to 2014.
Looking at a glance over the graph, it is apparently evident that there had been a steady increase in the books count over the three years even though there was a slight dip in the number of books read by women. Men had shown more interest in reading books than women by the end of the given period.
Women’s interest in books had risen sharply from 5000 in the year 2011 to 10,000 by the year 2013. On the other hand, this amount had started at only 3000, less than women, in the year 2011. Even though there was only a slight increase of 1000books by the year 2012, this figure had increased rapidly to overcome women by the year 2013 to reach further at 14000 by the end of the given time frame.
Follow Us on IELTSFever Twitter for more updates