The graph shows Underground Station Passenger Numbers in London. Summarise the information by selecting and reporting the main features, and make comparisons where relevant.
 Sample 1
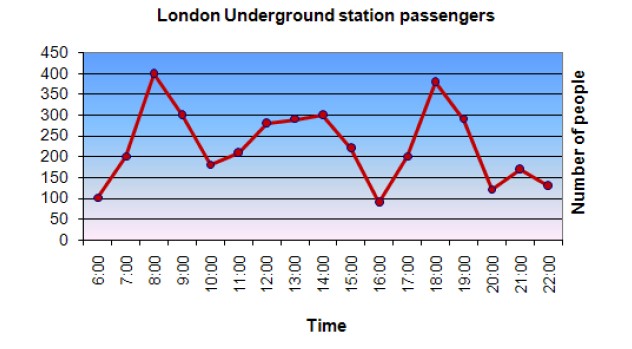
The given line graph illustrates information about the total travellers of the underground station for London in numbers.
Overall, it can be observed that more citizens travel in the morning hours and evening hours whereas fewer inhabitants prefer to go in the mid-afternoon through underground stations in the country of London.
In the morning hours, at 6:00 am only 100 passengers travel through the underground station, and later in 8:00 it has been increased significantly to four hundred passengers, and after that, it drops to nearly 180 passengers. On the other hand, in the afternoon fewer people opt for the underground station only 280 passengers prefer this mode whereas after 12 pm it rose significantly to 300 passengers. At 4 pm, it plummeted to almost 100 passengers.
In the evening hours, the trend is almost the same as the morning hours in which it can be seen from the line graph that at 5 pm it rocketed to 400 passengers and fell minimally to 300 passengers. After 8 pm it leapt to 100 passengers and increased slightly to 160 passengers and then decreased to110 passengers.
Follow Us on IELTSFever Twitter for more updates
Sample 2
📉 The line chart illustrates the information about the number of passengers at the underground station in London.
🔍 Overall, it is visible from the line chart that the highest number of people use the underground station in London at 8:00 a.m. and 6:00 p.m.
📈 Considering the given data, at 6:00 a.m., 100 passengers can be found at the station. This number increases steadily until 8:00 a.m. when the number of passengers reaches 400. After that, at 8:00 a.m., the number of passengers decreases steadily until 10:00 a.m., reaching around 180.
Moreover, the fluctuation of numbers continues until 4:00 p.m.; on average, 200 passengers can be observed during this period. Then, at 4:00 p.m., the passenger number increases and reaches 380 at around 6:00 p.m. In addition, after 6:00 p.m., the number of passengers decreases with fluctuation until 10:00 p.m.
📊 In short, the highest number of passengers at London underground stations is between 8:00 a.m. and 6:00 p.m.
Discover more from IELTS Fever
Subscribe to get the latest posts sent to your email.


