
The graphs below show the numbers of male and female workers in 1975 and 1995 in several employment sectors of the Republic of Freedonia. Write a report for a university teacher describing the information shown.
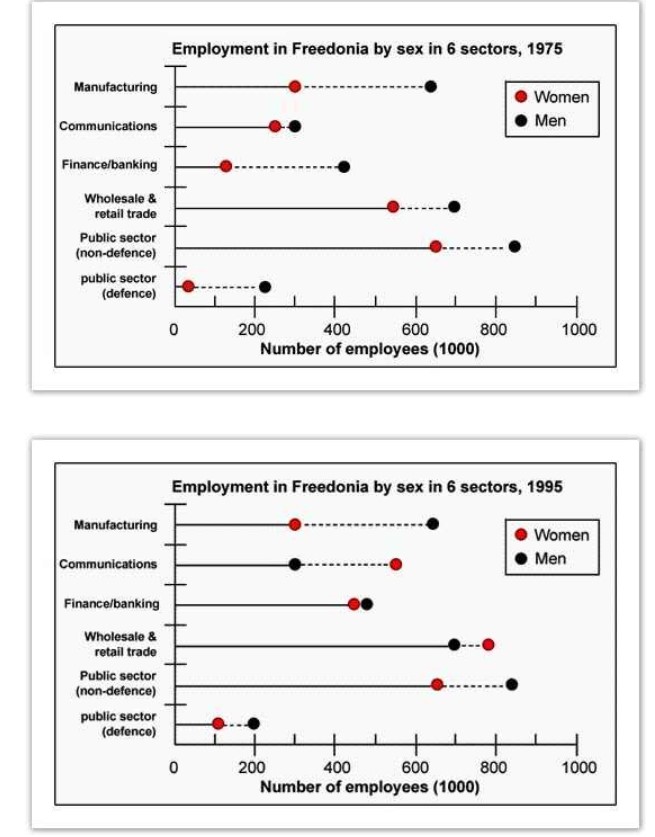
The yielded diagram demonstrates the number of employment in Freedonia by gender wise, male and female in six different sectors in 1975 and 1995.
Overall, it can be clearly seen that in starting year, in the all sectors male number was higher than the female which changed in 1995.
For manufacturing, In 1975, male and female works number was roughly same in manufacturing unit while after two decades, the male number were more 100000. For communication, the male number was the same as was female in manufacturing and female had 210000 whereas, in 1995, the male number remained the same but the female double in 20 years. For finance or bank, 410000 and 115000 employment number was for male and female respectively in 1975 however, after two decades, the female number rose steadily and had same as the male had in 1975, the male number grew on account of 500000 had.
For the non-defence public sector, employment numbers remained unchanged throughout the period, which was 625000 for females and 82500p for males. For wholesale, in 1975, male workers number was 700000 which remained same later but, female employees number grew 525000 to the zenith point, 80000p. The public sector had 210000 employees, after 20 years, it was 300000, and this change happens owing to female recruitment.
Follow Us on IELTSFever Instagram for more updates and the latest test tasks.
Also, Read The Chart Below Shows the Percentage of Young People in Higher Education
Discover more from IELTS Fever
Subscribe to get the latest posts sent to your email.


