
The Graphs Below Show the Us Citizens’ Unemployment Rate, with A Further Classification Displaying the Average Weekly Salary in 2005. Summarise the Data by Selecting and Reporting the Main Features and Making Comparisons Where Relevant.
 Sample Answer: The Graphs Below Show the US citizens’ Unemployment Rate
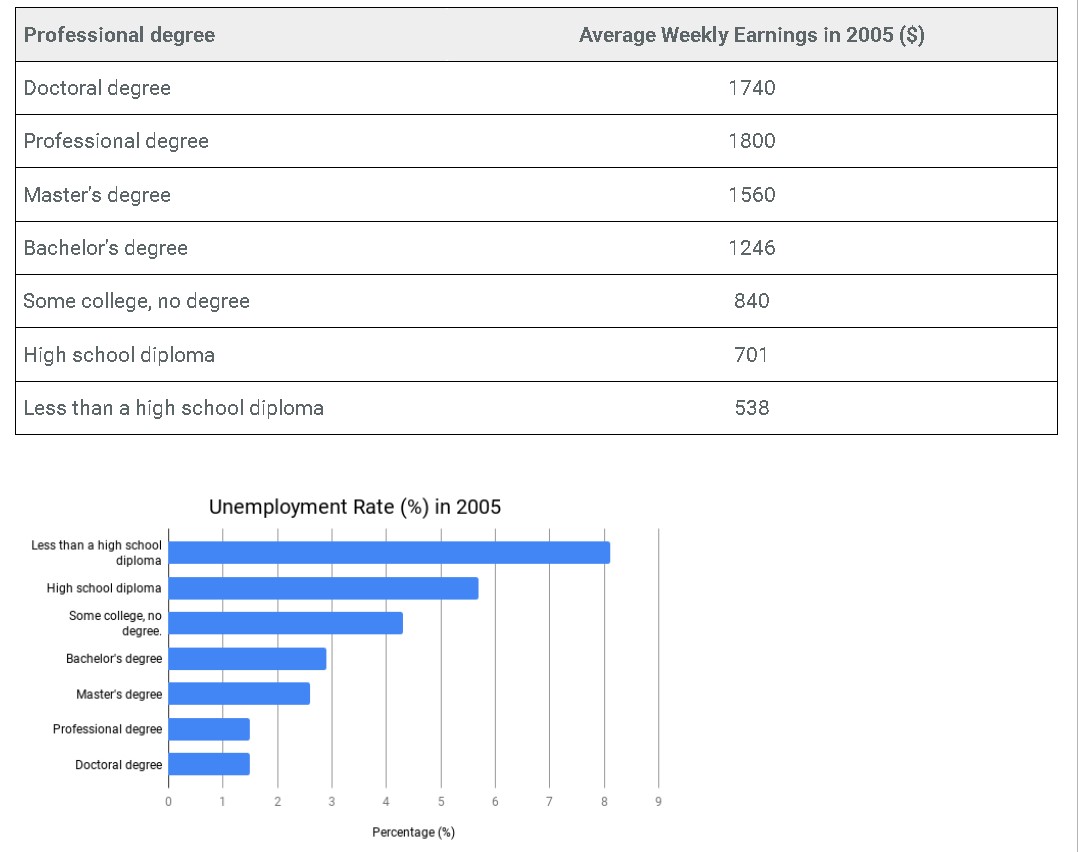
The graphs illustrate the unemployment rate in percentages. It also shows the average salary per week in (dollars) of US citizens in the year 2005. Overall, it is seen that the unemployment rate is high among people whose education levels are below a high school diploma, while people with professional degrees earn more money weekly.
Firstly, people are paid according to their level of education. People with higher levels of education receive more than others. Professional and doctoral degrees earn more, with professional degrees earning $60 more than postgraduates.
However, citizens with a low high school diploma earn the lowest, $5388 per week. In addition, those with master’s and bachelor’s degrees earn above $100, while others earn below $538 per week.
Also, the rate of unemployment slightly increased from individuals with no degree but who went to college(above 4%) to those with a high school diploma ( nearly 6%)and lastly to people with qualifications less than a high school diploma (a bit more than 8%).
Therefore, it is noticeable that people with qualifications less than a high school diploma were most unemployed, while those with doctoral and professional degrees had less unemployment.
Follow us on the IELTSFever Facebook Page for more updates
Discover more from IELTS Fever
Subscribe to get the latest posts sent to your email.


