


The Line Chart Shows Average Attendance at The Cinema Among Various Age Groups in The Us from 2000 to 2011. Summarise the Information by Selecting and Reporting the Main Features, and Make Comparisons Where Relevant.
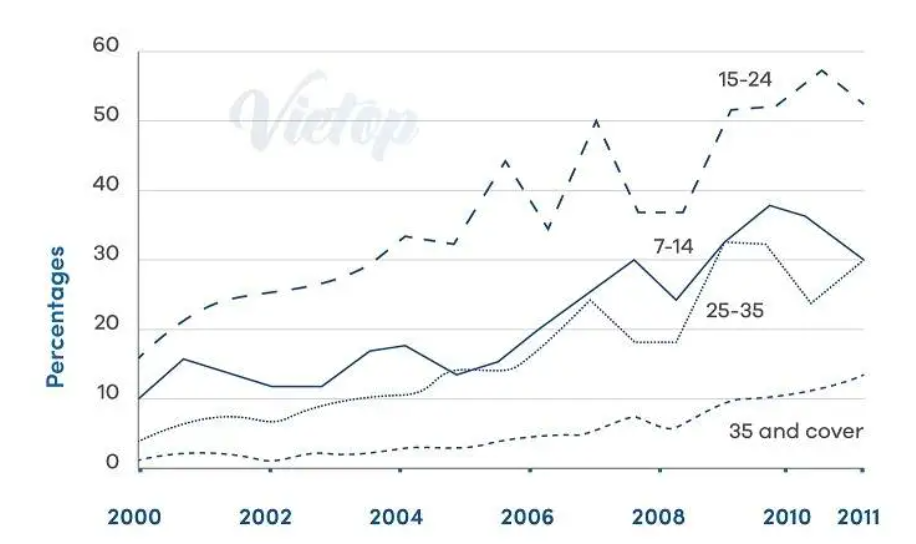
The line chart illustrates how many Americans in different age groups visited the cinema between 2000 and 2011. Units are measured in percentages.
Overall, although there was a significantly low percentage of senior adults(35 and above) attending the cinema, teenagers (15 to 24) are oversaturated. On the other hand, there were relatively the same percentages of juveniles (7 to 14) and junior adults (25 to 35) over the period.
From 2000 to 2005, there was a considerable increase in junior adults from age 15 up to 24 going to the cinema; however, the trend went through an erratic period from 2006 to 2007, before it reached its climax in 2011 with over 50%. In contrast, US residents aged 35 and above were the least age group to love cinema, with a peak of approximately less than 15% in 2011.
Despite the difference between Juvenile and Junior adults in the beginning in 2000 at 10% and just below 5 % respectively, they maintained exactly the same percentage in 2005, with a slightly below 15%, as well as at the end of the given time period at 30 per cent.