
The line chart shows average attendance at the cinema among various age groups in the US from 2000 to 2011. summarise the information by selecting and reporting the main features, and make comparisons where relevant.
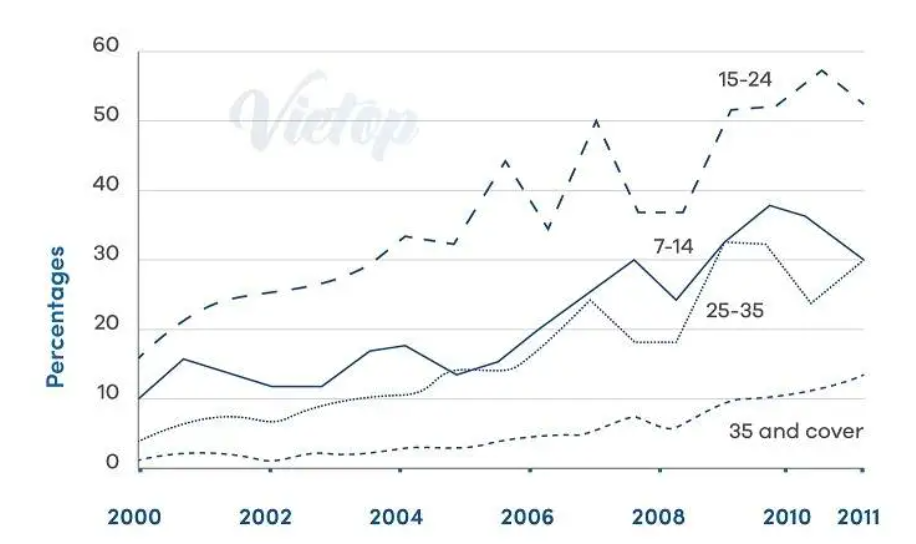
The line graph illustrates the uses of movie theatres by four different age groups over a period of 11 years from 2000 to 2011.
Overall, it is immediately apparent from the chart that, in the age of youngsters 15-24 were mostly addicted to theatre and others two age group 7-14 and 25- 35 were equally approached with a similar trend of movie cinema in 2011.
In detail, the percentage of youngsters rely upon aged between 15-and 24 who preferred to watch movies at theatre began at 17% in 2000, and this ratio surged over the years and reached at with shares 31% in the year 2005. Moreover, a massive inclination was observed, and this value got increased by 19% after two years. Whereas the 17-14 age group again skyrocketed after the downfall and hit the peak at approximately 57% in the year 2010. Therefore, in the term of mature people with the age group of 35 and cover had less interest in watching movies in cinema with a fraction and insignificant amount and not interested over the years but in 2008, this value slightly moved upwards to 10% and sprung up with a majority in 2011.
Furthermore, the children from 7-14 age group watched movies in cinema at 10% in 2000 and got fluctuated similar with 25-35 age group and intersected each other with shares nearly 13% in 2005 and skyrocketed, which accounted by 17% in 2008 and 25-35 age group recorded at 10% in 2007. It is interesting to note that, the attendance at cinema gradually hiked at nearby 40% in 2010 in the age group of 7-14 and 25-35 age group declined their interest towards the pictures and below 20% in 2008 but sprung up with 12% in 2010 and both age groups touched the barrier at 30% in the final year.
Follow Us on IELTSFever Twitter for more updates
Discover more from IELTS Fever
Subscribe to get the latest posts sent to your email.


