The pie chart below shows the results of a survey of the causes of poor learning outcomes in schools in a particular country in 2011. Summarise the information by selecting and reporting the main features, and make comparisons where relevant.
 Sample Answer of The Pie Chart Below Shows the Results of A Survey of The Causes of Poor Learning Outcomes in Schools
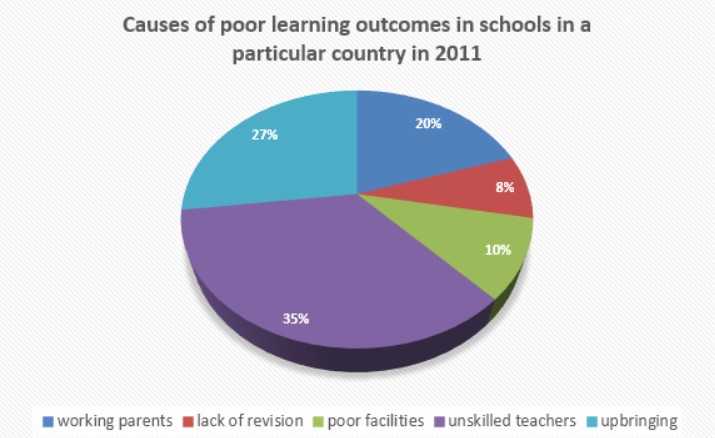
The pie chart presents the survey results of why pupils in a school poorly performed in a country in 2011.
Overall, it is clearly seen that inexpert teachers and parents behaviour were the main reason for students to perform poorly in school.
From the pie chart, it can be said that the main reason why children perform inadequately were the unskilled teachers the portion is 35%. Also, the one main reason outcome from pie chart was the upbringing of students affects the school learning process with 27%. Along with this, there is another reason to add-on working parents were affecting child’s development (20%) in learning performance.
However, a lack of revision with 8% was also the reason that students could not perform up to the mark. Moreover, the school does not have proper facilities to provide to students for their better development which is from the survey is 18%.
Follow Us on IELTSFever Twitter for more updates
Discover more from IELTS Fever
Subscribe to get the latest posts sent to your email.


