The Pie Charts Below Show the Online Shopping Sales for Retail Sectors in Australia in 2010 and 2015. Summarise the Information by Selecting and Reporting the Main Features and Making Comparisons Where Relevant.
The pie charts below show the online shopping sales for retail sectors in Australia in 2010 and 2015. Summarise the information by selecting and reporting the main features and make comparisons where relevant.
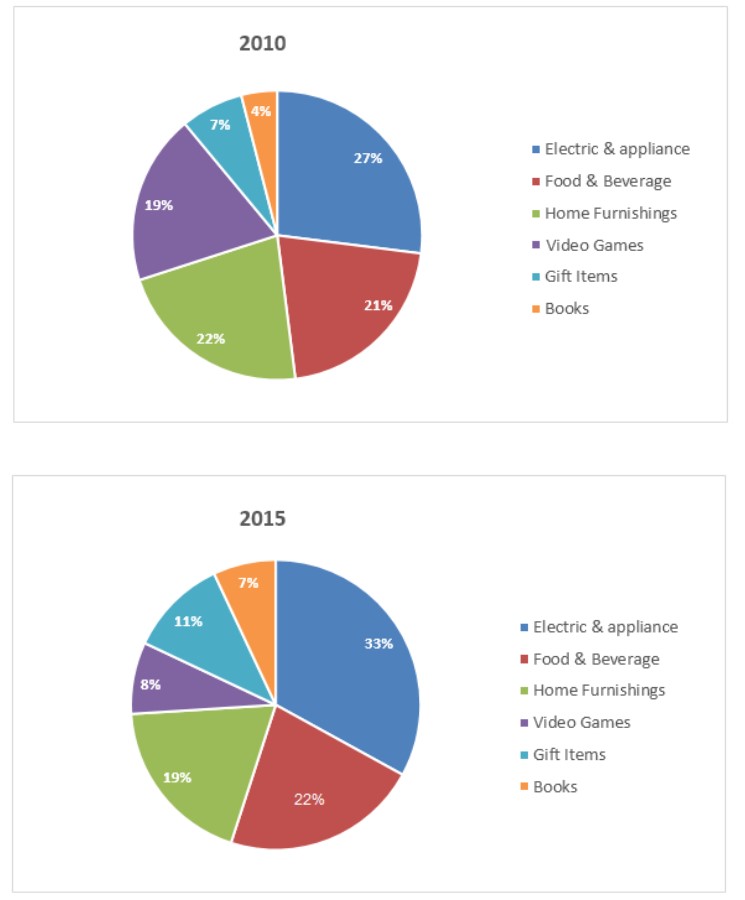
The pie charts compare the online retail shopping trends in Australia in 2010 with those in 2015.
According to the illustration, 27% of online retail sales in Australia in 2010 were made by electric appliances, which was followed by home furnishing and food and beverage commerce with exactly 22 and 21 per cent respectively.
Video games purchased by Australian consumers comprised 19% of total online sales this year. Finally, gift and book sales accounted for 7% and 4% of online retail sales consecutively in 2010.
After half a decade, electric product sales increased by 5%, and it comprised one-third of the total online sales in 2015. E-commerce of food and beverage items slightly increased while a nominal decrease could be observed in the trade ratio of furniture.
Video games became less popular among Australian online consumers as their sales dropped below half, while a surge could be noticed in the gift items’ sale ratio. Books as an online retail product were sold more in percentage in 2015 than in 2010.
Overall, electronic products, food and furniture comprised the highest percentage of online sales in Australia in both years.
Follow Us On IELTSFever Facebook Page For More Updates
Discover more from IELTS Fever
Subscribe to get the latest posts sent to your email.