

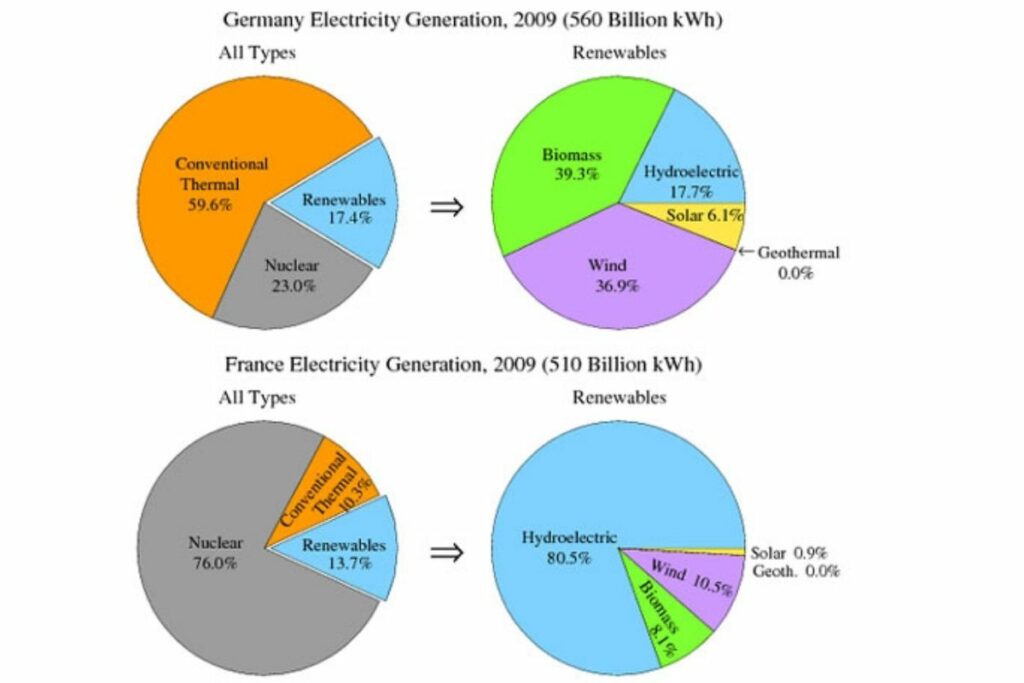
The pie charts show the electricity generated in Germany and France from all sources and renewables in the year 2009.

Summarise the information by selecting and report in the main features, and make comparisons where relevant.
Write at least 150 words
Sample 1
The Pie Chart depicts the electricity produced from all sources in 2009 between two countries (Germany and France) and their renewables. The rate o electricity generation varied between both countries.
In 2009, Germany generated 560 billion kWh of electricity with its major source from conventional thermal recording 59.6%. Following that, Her second largest was obtained from nuclear with 23% and renewables following behind with 17.4%.On the other hand, France generated 510 billion kWh of electricity with nuclear as the highest having 76.0% while renewables followed by 13.7%. Unlike Germany, with the highest percentage of conventional thermal, France recorded a major decrease of 10.3%, making it the least source of electricity generated from all types.
Both countries had renewables at the end of the year. Germany had a major percentage in Biomass, Wind, and Hydroelectric (39.3%, 36.7%, 17.7%), respectively, while France had an overall 80.5% in Hydroelectric with Wind 10.5 and Biomass 8.1. Solar and Geothermal had the least percents of renewables in both countries. Although both countries had major differences in conventional thermal and from other sources, they shared similar 0% in geothermal.
Sample 2
Electricity generation from various sources and renewables in Germany and France is depicted in the form of pie charts. It can be noted that in the year 2009, Germany generated a total of 560 Billion KWh while in France, a slightly lesser quantity of 510 Billion KWh was produced.
The conventional thermal source was the major contributor owing to 59.6% in Germany, whereas in France, the Nuclear source provided a whopping 76% contribution. The renewable resources offered 17.4% and 13.7% aid in Germany and France, respectively.
The four renewable resources, namely biomass, the solar, wind, and hydroelectric were in 39.3:6.1:36.9:17.7 proportion for production of electricity in Germany; however the percentages were 8.1%, 0.9%, 10.5%, and 80.5% in France.
Contrasting between Germany and France, it is clearly noticeable that when considering all types of resources, Germany makes maximum use of conventional thermal resources and France optimally uses modern resources like Nuclear power to produce electricity.
This is the end of the AC Writing ( The pie charts show the electricity generated in Germany and France )
Follow us on Pinterest