The table below presents the food consumption per person weekly in a European country in 1992,2002, and 2012. Summarize the information by selecting and reporting the main features, and make comparisons where relevant.
 Sample Answer of The Table Below Presents the Food Consumption Per Person
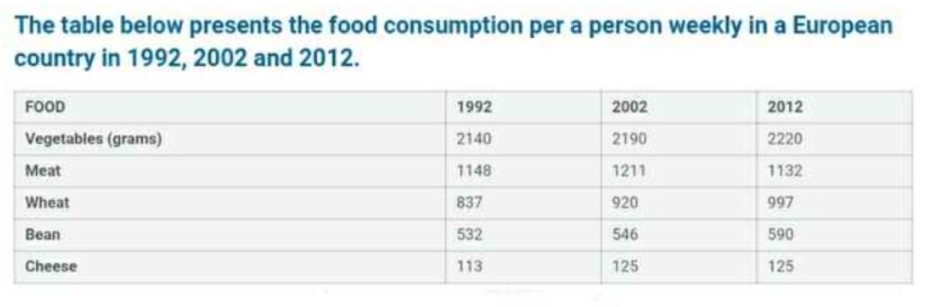
The provided table demonstrated the weekly basis per head five different food consumption in a European country in 1992, 2002 and 2012, food measured unit was grams.
Overall, all foods consumption was rose slightly year by year except meat in 2012; the vegetable was most ate food through period and cheese was on least.
For vegetable, 2 Kg and 140 grams were eating per person in 1992, and after a decade, it has only 50 grams increased; in 2012, it has 2220 gram consumption. For cheese, with 113 grams usage, it was the lowest consumption in 1992, and it remained the same after that time on account of 125 grams. For meat, nearly above 1 KG meat used per single person in 1992, and after two decades it declines slightly to 16 grams although, between that period it touched its peak 1211 grams.
For bean, per head consumption was likely half of meat in 1992, and it had 546 grams and 590 grams respectively in 2002 and 2012. For wheat, usage was 837 grams in 1992 and 920 in 2002; after a decade, it was near 1 KG consumption in 2012.
Discover more from IELTS Fever
Subscribe to get the latest posts sent to your email.