
The table below shows the figures for imprisonment in five countries between 1930 and 1980. Write a report for a university lecturer describing the information shown below.
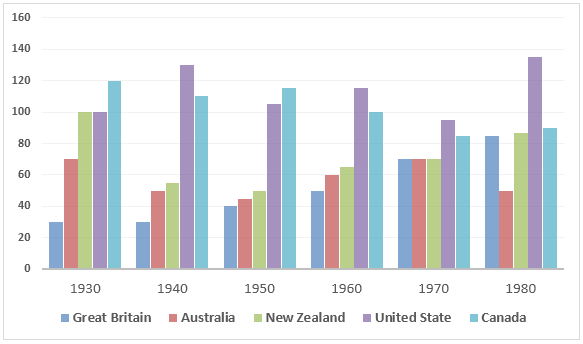
This histogram depicts the numbers of prisoners in five different nations from 1930 to 1980.
Overall, the number of prisoners in Canada has fallen while it has increased in Great Britain from 1930 to 1980.
Regarding Great British, imprisonment was less than 40 in 1930 and remained plateau for ten years. The figure reached more than 80 in 1980, which was more than doubled as compared to 1930. However, in Canada, it was exactly 120 in 1930, but in 1980, it down surged to below 100
Similarly, in Australia, the number of prisoners was more than 60 in 1930, but in 1940, it decreased to less than 60 and remained almost steady until the next decade. After that, the number reached just below 80 in 1970, and it experienced a sudden downfall in 1980, to just below 60.
Initially, in 1930, both New Zealand and the US had an equal number of prisoners. But in the United stead, the number fluctuated in different years, reaching just below 140 in 1980. It witnessed a dramatic downfall in New Zealand to just below 60 in 1940 and remained steady till 1950. Since then there has been a constant increase in number, reaching above 80 in 1980.
Discover more from IELTS Fever
Subscribe to get the latest posts sent to your email.


