


The table below shows the proportion of different categories of families living in poverty in Australia in 1999. Summarise the information by selecting and reporting the main features and make comparisons where relevant.


SAMPLE ANSWER 1:-The Table Below Shows the Proportion of Different Categories of Families
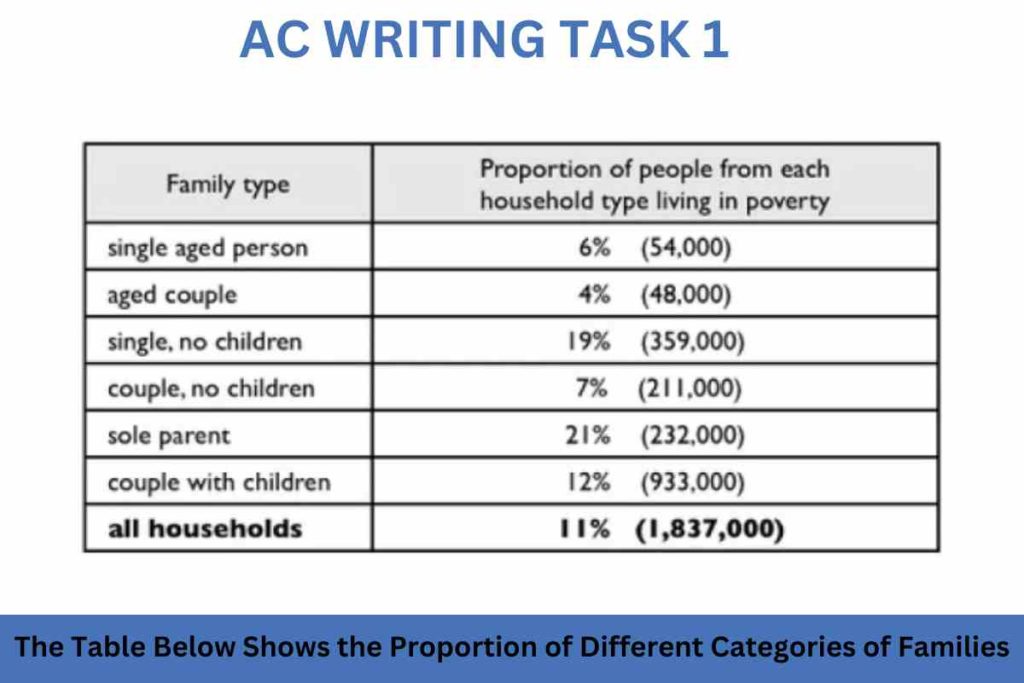
As from the upper table information, prevailing a view on different categories of families on poverty in Australia during theyear1999. there was a lot of families type in Australia suffering from the poverty problem in year 1999
It can be observed that single elderly individuals comprise only six percent of the total. The family type with the lowest poverty rate is aged couples, accounting for up to 48000 individuals. Conversely, the proportion of households living in poverty with childless couples is 19% (approximately 359,000 people).
Shifting the focus to the next family category, sole parents have the highest representation, constituting 21% of all households. Furthermore, couples living with their children amount to 933,000 individuals. Lastly, the combined total of all households in poverty stands at 11% (equivalent to 1,837,000).
In conclusion, the family type with the highest poverty rate is sole parents, whereas aged couples represent the lowest proportion of households living in poverty.
![]()
