
 The given table illustrates the information related to the study of a university’s reviews in five different areas given by pupils in the years 2000, 2005, and 2010.
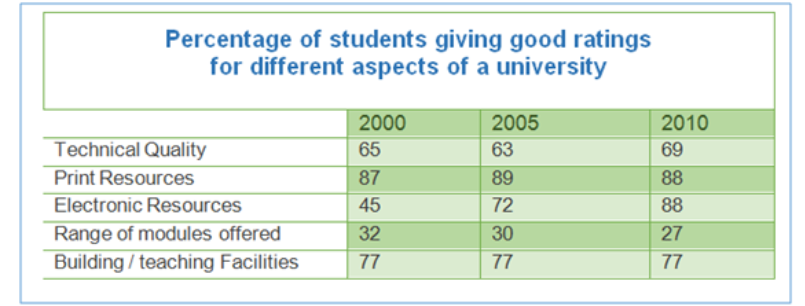
Overall, the table reveals that the review of electronic resources was not satisfactory for students in the first year, but at the end of the period, it became the opposite. Another interesting fact is that except for the modules offered by the college, the other four facilities reviewed were excellent.
At first, in 2000, print resources received the highest review, with 87%, while the opposite range of modules offered only had 32%. For other technical quality and building facilities, they got 65% and 77% reviews, respectively, whereas electronics resources got 45% reviews.
After the next five years, technical quality and modules offered decreased by 2% in their reviews, while print resources and building facilities had 89% and 77% reviews, and electronics resources were suddenly hyped in reviews with 72%. At the end of 2010, and for the entire range of modules (27%), all others had nice reviews, print and electronics resources (88%), technical quality (69%), and building facilities were the same as previously.
Subscribe to Us On the IELTSFever YouTube channel For Tips And Tricks and Real Exam Tasks
Discover more from IELTS Fever
Subscribe to get the latest posts sent to your email.


