The table shows the worldwide market share of the mobile phone market for manufactures in the years 2005 and 2006. Summarise the information by selecting and reporting the main features, and make comparisons where relevant.
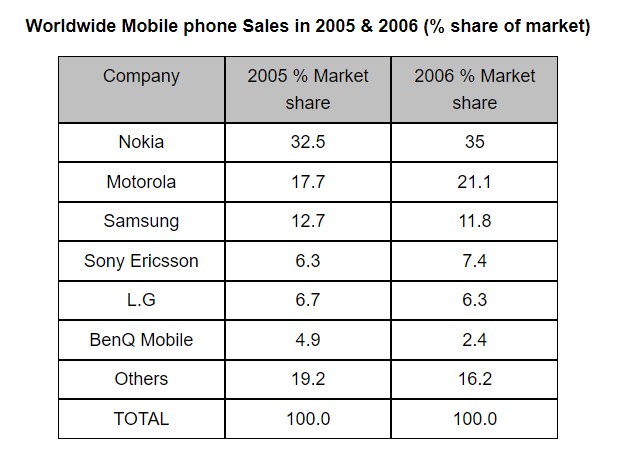
The table illustrates the proportion of the market share of mobile phone services around the globe for manufacturing usages in 7 different companies, Nokia, Motorola, Samsung, L.G, BenQ Mobile and others between 2005 and 2006.
Overall, from 2005 to 2006, Nokia was the most popular mobile phone service provider, while BenQ Mobile had the least market share among those companies. The percentage of the mobile phone market of Nokia, Motorola and Sony Ericsson increased steadily, while the rest of others declined throughout the period.
To begin with, it can be seen that in the year 2005, Nokia was the top number among others at 32.5%, following Motorola was 17.7% and their market share rates rose continuously by 2.5% and 3.4% respectively in 2006. In addition, Sony Ericsson was 6.3% of the whole market share, and it also grew by roughly 1% between 2005 and 2006.
Moreover, Samsung, L.G, BenQ Mobile and other companies had a downtrend of global mobile phone market share during those periods. Among those companies, the worldwide market share of BenQ Mobile and others fell rapidly from 4.9% to 2.4% and from 19.2% to 16.2%, respectively, while Samsung and L.G companies decreased slightly by approximately 1% and 0.4%.
Follow Us on IELTSFever Instagram for more updates and the latest test tasks.
Also Read The Bar Chart Below Shows the Numbers of Men and Women Attending
Discover more from IELTS Fever
Subscribe to get the latest posts sent to your email.