
The Chart Below Shows the Global Sales of Different Kinds of Digital Games From 2000 to 2006. Summarize the information by selecting and reporting the main features, and make comparisons where relevant.
You should spend about 20 minutes on this task.
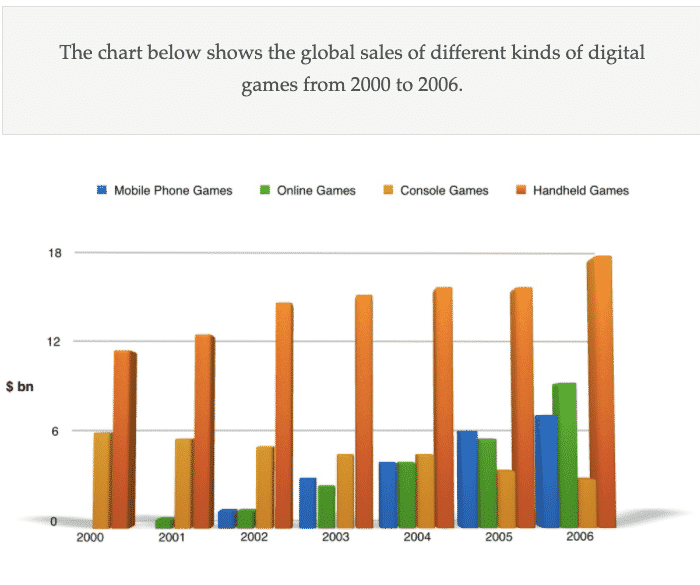
Sample 1 Answer of Global Sales of Different Kinds of Digital Games From 2000 to 2006
The bar chart illustrates the global sales of mobile phone games, online games, console games and handheld games from 2000 to 2006. The measurement is done in billions of dollars.
Overall, it can be seen that from the initial year till the last the sale of handheld games remained high among these games. Mobile phone games, online games, and handheld games experienced an upward trend whereas console games showed a downward trend.
In the first two years, no data had been shown for mobile phone games followed by online games. The sale of online games commenced in 2001 which was 1 billion dollars. Afterwards, their sales increased considerably throughout the period. In 2002 and 2004 the sale of both the games remained equal at around 2 and 4 billion dollars respectively. There was an increase of 3 billion dollars in the sale of mobile games and the sale of online games reached 10 billion dollars in 2006.
The sale of console games dropped gradually over the period while handheld games increased steadily for the given time period. In 2002, the sale of console games was approximately 6 billion dollars and the sale of handheld games was doubled the sale of console games in that very period. In 2006, the sale of handheld devices increased to 18 billion dollars whereas the sale of console games reached half of its initial period (2000).
Sample 2 Answer of Global Sales of Different Kinds of Digital Games From 2000 to 2006
Overall, handheld games contributed the most and had a steady increase throughout. The figures for console games kept reducing whereas that of online and mobile games continued to grow from their inception in 2001 and 2002 respectively, to the end of the period.
With regards to handheld games, the initial figure was about $11billion in 2000 and saw a continuous growth until 2004 where sales reached approximately $16billion. This amount remained stable the following year before experiencing a rise to $18billion at the end of the period. Similarly, the amounts earned from online and mobile phone games were the same in 2002, being around $1billion, and in 2004, a growth of both to close to $4billion. Although money gotten from playing games on cell phones had surpassed that gotten from online games in years 2003 and 2006, there was a reversal at the end of the period where online games income overtook that of phone gaming at nearly $2billion.
Revenue from console games in the year 2000 stood at $6billion, over half of that of handheld games in the same year. However, the subsequent years witnessed a gradual decline until 2003 where it levelled off in the next year, yet afterwards continued its fall into 2006 where sales generated only amounted to about $3billion- a 50% reduction of the initial figure.
Discover more from IELTS Fever
Subscribe to get the latest posts sent to your email.


