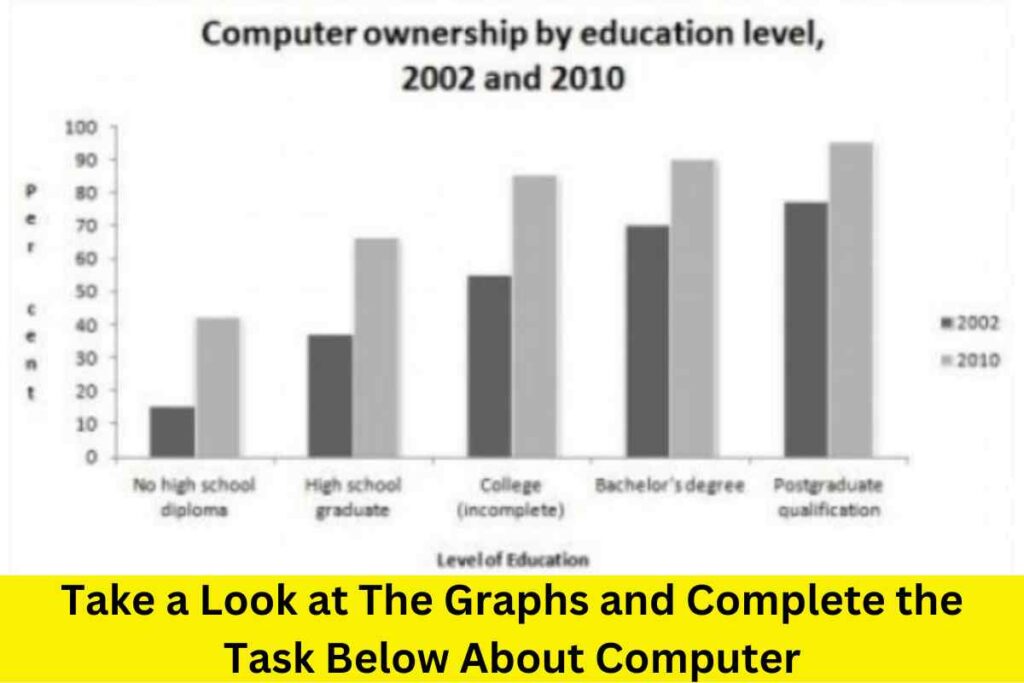
Take a look at the graphs and complete the task below about computer ownership by educational level, 2002 and 2010. Summarise the information by selecting and reporting the main features and make comparisons where relevant.
 Sample 1:- Take a Look at The Graphs and Complete the Task Below About the Computer
The given bar graph depicts the trend of computer ownership in various academic institutes for a period of 8 years from 2002 to 2010.
Overall, the ownership has steadfastly increased as the year progresses, which will be elaborated further. In relevance to post-graduation qualifications, it was highest at around 100 per cent in 2010 and 20% less in 2002. The high school usage was less than 40% in both years simultaneously.
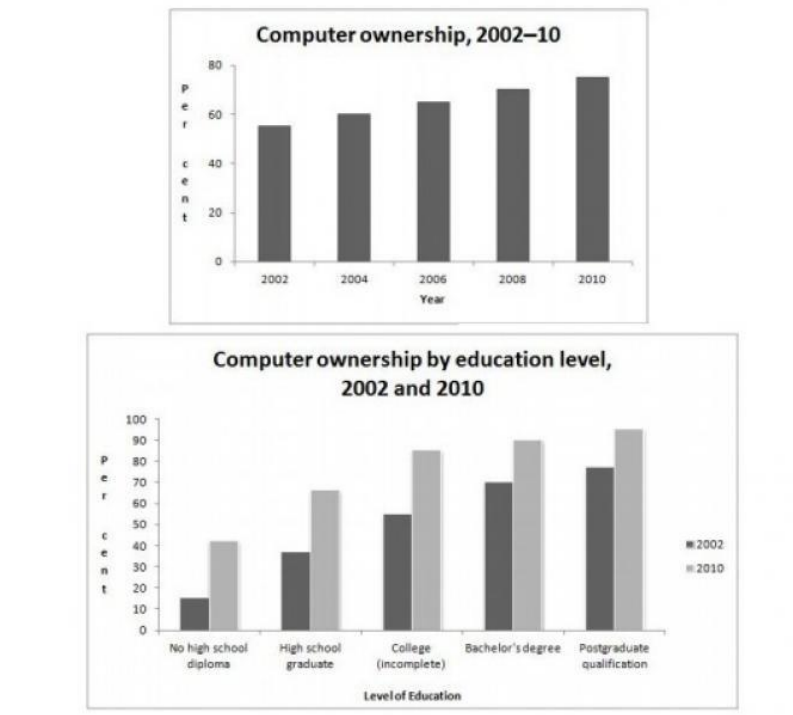
Less than 60% owned computers in 2002, and every two years, the trend peaked at roughly 5% or more and reached around 80% by 2010 in just eight years.
The high school diploma students in 2002 owned just 10% of computers. Still, that figure soared to 40% in 2010, and an average 3-fold increase was also noticed among college and high school academics, respectively. The trend, however, shortened to twofold in bachelor’s degree and post-graduation students. In 2002, there was 70% ownership in bachelors students, which reached 90% in 2010, and post-graduation students owned 80% computers, which reached 100% by 2010.
Sample 2:- Take a Look at The Graphs and Complete the Task Below About the Computer
The graphs depict the trend of computer ownership for the eight years and the level of ownership by educational level in 2002 and 2010 in percentages.
To begin, it is apparent that ownership of computers increased steadily over the eight-year period, and the level of ownership by educational level increased gradually as the people progressed academically.
In the early part of the period, ownership of computers was just below 60%, and it attained exactly 60% in the following two years. The pattern of ownership continued to increase till the end of the period, revolving from a little above 60% to nearly 80%. It attained its peak in the year 2010 by reaching 78%.
The number of computer owners by level of education was comparatively higher in 2010 than in 2002. The highest number of owners of computers in both years were people with post-graduate qualifications, thus attaining 80% and 100% in 2002 and 2010, respectively. Ownership among people with a Bachelor’s degree was 90% and 70% in 2002 and 2010, respectively. People who did not complete college had 85% ownership of computers in 2010 and 55% in 2002. There were almost three times the owners of computers in 2010 as compared to those in 2002 among people with no high school diploma and almost twice in 2020 among those with high school diplomas as in 2002.
In conclusion, it is known that there was an increase in ownership of computers within the period of 2002 to 2011; however, ownership of computers by the educational level increased as people increased their level of education.
Discover more from IELTS Fever
Subscribe to get the latest posts sent to your email.


The bar charts illustrate the changes in the percentages of owning computer devices between 2002 and 2010 in terms of education degree. Overall, there is a gradual increase in possessing PCs throughout the period and postgraduates own the highest number of computer devices.
To begin with, in 2002, below 60% of people had PCs and this percentage increase slightly in 2004 and stood at nearly 60%. There was a rise in the following year and reached to approximately 80% by the end of the period.
In regard to the ownership according to education levels, people who did not get high school diploma represented only 10% of those who had computers in 2002. However, this percentage rose exponentially to above 40% in 2010. Similarly, there was a growth in owning those devices in 2010 in terms of all educational degrees. Moreover, individuals who had higher education levels owned more computers than those who had lower levels. Consequently, the ratios of owning ship rose from nearly 40% and 55% to 60% and 80%. Postgraduates reached full capacity around 98%.