


The bar chart below shows the numbers of men and women attending various evening courses at an adult education centre in the year 2009. The pie chart gives information about the ages of these course participants. Summarize the information by selecting and reporting the main features, and make comparisons where relevant.
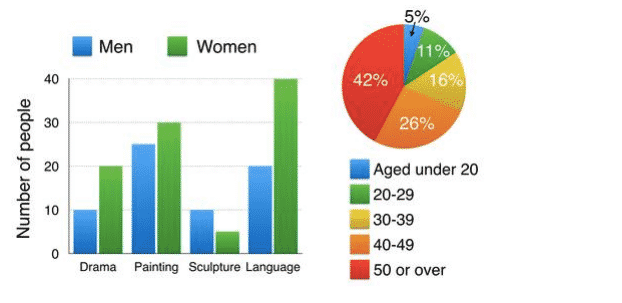

The bar graph illustrates the number of people from both genders who attended different evening courses such as Drama, Painting, Sculpture and language in the year 2009 at an adult education centre. The pie chart illustrates data on the ages of participants who attended these courses.
In 2009, women loved to attend maximum language courses (40 women) and were least likely to visit sculpture (nearly 5 women only), Although men attended painting class nearly 25 in number. In contrast, women are 30 in the same course. However, men attended drama and sculpture classes equally, which is 10 persons each and men and women attended language and drama classes on an average of 20 each simultaneously.
Furthermore, 42 per cent of the total population who attended various courses are the age of 50 and above, and only 5 % are under 20, and people from 20-29 are 11%, and from the age 40 to 49 are 16%. Lastly, nearly a quarter of the population from 40-49 are attended(26%).
Overall, in 2009 mostly older people attended various courses and out of this, women love to attend language classes; however, men visited painting classes most.
Follow Us on IELTSFever Instagram for more updates and the latest test tasks.
Also, Read The Following Bar Chart Shows the Different Modes of Transport