


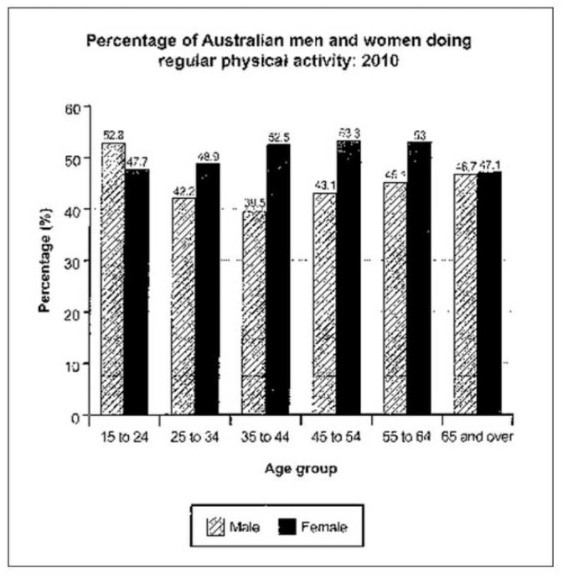
The bar chart below shows the percentage of Australian men and women in different age groups who did regular physical activity in 2010.

Sample Answer of The bar chart below shows the percentage of Australian men and women
The given Bar graph compares the proportion of Australian gender in six distinct age categories who were physically active on regular basis in the isolated year 2010.
As it can be clearly seen, the proportion of females aged between 35-44 were highly active; whereas the proportion of males in the age group of 35-44 seem to be least physically active with just 40%.
Probing ahead, a resemblance can be seen in the proportion of males and females who were physically active in the age 65 and over which was noted as nearly 47%. Moreover, a minute discrepancy of 5% can be witnessed in the proportion of males and females between the age group 15 to 24 noted as 52.8 and 47.7 respectively. The physical activity of males rose to around 45% while the proportion of active females remained around 8% higher at 53%. In conclusion, it can be seen that the majority of males particularly teenagers do more exercise, whereas the number of females, mainly those aged 45- 54 engaged in physical activities more compared to female teenagers.
Follow Us on IELTSFVER Pinterest