Sample 1: The bar chart gives information about the life expectancy in Japan
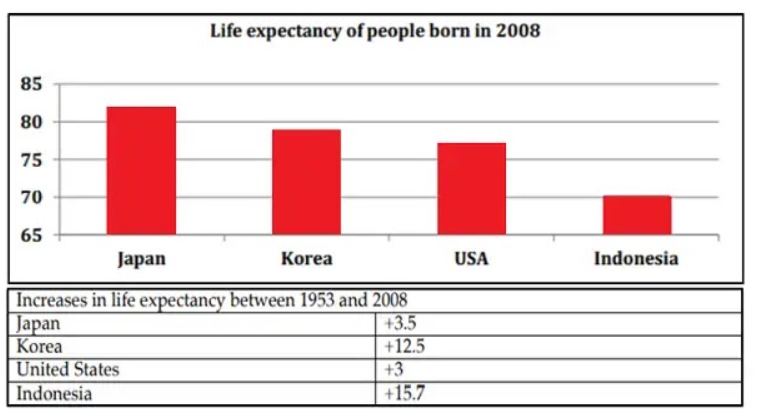
The bar chart compares the life expectancy of people in four countries in 2008, and the table provides information about the life expectancy change between 1958 and 2008 in these four countries.
Overall, the life expectancy was the highest in Japan and lowest in Indonesia. The increase in life expectancy was greater in Indonesia than in other countries.
In 2008, Japan had a much higher life expectancy, which was close to 82 years, whereas Indonesia had the lowest life expectancy rate of about 70 years. The life expectancy of people in Korea was higher by nearly two years than that of the people in the USA, with approximately 77 years of life expectancy.
Between 1953 and 2008, the life expectancy of people in Indonesia showed a remarkable increase of 15.7 years, while a growth of 12.5 years can be observed in Korea. While the USA saw the lowest rise in life expectancy with three years, it was a little greater in Japan than in the USA by 0.5 years.
Sample 2: The bar chart gives information about the life expectancy in Japan
The bar chart illustrates the life expectancy in four countries: Japan, Korea, the USA and Indonesia. The table represents the changes in life expectancy between 1953 and 2008.
Overall, the highest life expectancy of people born in Japan was in 2008, whereas the lowest was in Indonesia. The majority of individuals increased in life expectancy in Indonesia between 1953 and 2008.
To begin with, just about three-fifths of people were born in Japan in 2008. After that, in Korea and the USA, nearly 3 quarters of people were born in 2008. Now, the Indonesian people born in 2008 which was 65. Moreover, Indonesian people were born half compared to the USA in 2008.
Furthermore, the lowest increase in life expectancy in the United States in between 1953 and 2008. Indonesian people have a remarkable rise in life expectancy, which was 15.7 in between 1953 and 2008. In between 1953 and 2008, Korean people increased in life expect lastly, Japanese and US people had nearly the same life expectancy between 1953 and 2008.
Discover more from IELTS Fever
Subscribe to get the latest posts sent to your email.


