The Bar Chart Shows the Percentage of Australian Boys and Girls (school Pupils) Who Attend 4 Different After-School Sports Activities in 2010. Summarise the Information by Selecting and Reporting the Main Features, and Make Comparisons Where Relevant.
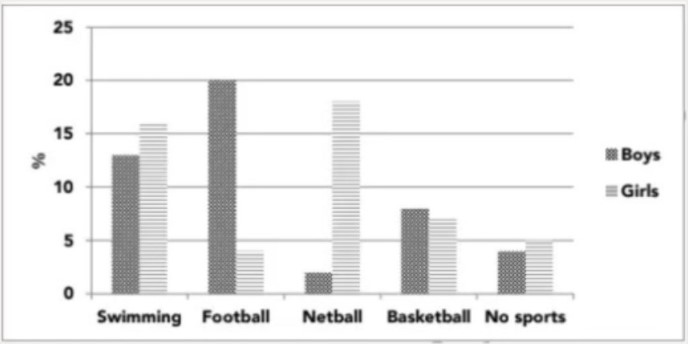
The bar graph illustrates the information about the percentage of Australian boys and girls attending four different sports activities after school in 2010
Overall, the bar graph shows that most boys preferred playing football, and most girls selected playing netball after school.
To begin with, the percentage of boys taking part in swimming activity was nearly 15 per cent, and the percentage of girls in swimming activity was greater than that of boys, which was a little over 15 per cent. Moreover, in netball, boys showed the least interest. However, girls showed very high interest in netball, which was nearly 20 per cent. Probing further, basketball played by both sexes has almost the identical percentage, which was a little over 15 per cent
Moving on to another detail, most of the boys were interested in playing football (20 per cent), while girls showed little interest (4 per cent). Furthermore, sports were played by both boys and girls, with percentages of 4% and 5%, respectively.
Discover more from IELTS Fever
Subscribe to get the latest posts sent to your email.