
The bar charts below provide information about honey production and honey-producing colonies in the five American states in 2006. Summarise the information by selecting and reporting the main features, and make comparisons where relevant.
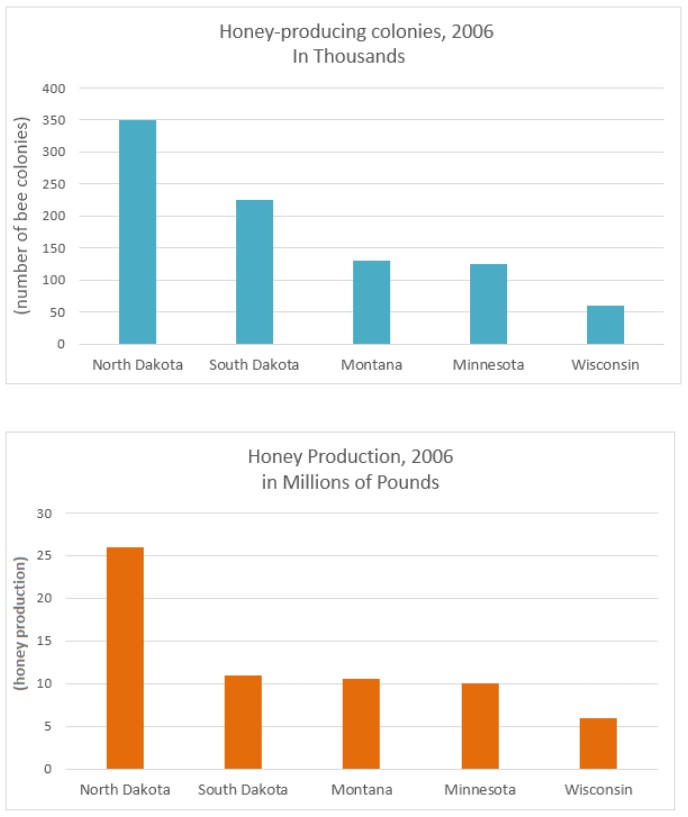
The yielded bar charts demonstrate the number of honey-producing colonies and honey production in five American states, North Dakota, South Dakota, Montana, Minnesota, and Wisconsin, in 2006.
Overall, it can be clearly seen that North Dakota had the most honey-producing colonies whereas Wisconsin had the least additionally, for honey production, those had more colonies, those states had more production.
South Dakota had 220000 colonies for honey-producing colonies, which were second-highest among five states; this state’s number of honey-producing colonies was double that Montana had. Montana and Minnesota had the same number of colonies. In addition, with 350000 bee colonies, North Dakota was on top of the tables while Wisconsin had half the numbers as Minnesota.
For honey production, North Dakota honey production was 26 million pounds which was far higher than others. Honey production in South Dakota, Montana, and Minnesota was roughly identical; Minnesota had only 1 million pounds less than South Dakota and Montana. Furthermore, the lowest Wisconsin profit was only 6 million pounds.
Follow Us on IELTSFever Instagram for more updates and the latest test tasks.
Also Read The Bar Chart Shows the Number of Cars Per 1000 People
Discover more from IELTS Fever
Subscribe to get the latest posts sent to your email.


