
The bar graph below shows the numbers of male and female research students studying six computer science subjects at a US university in 2011. Summarise the information by selecting and report in the main features, and make comparisons where relevant.
 Write at least 150 words.
Sample Answer of The Bar Graph Below Shows the Numbers of Male and Female Research Students
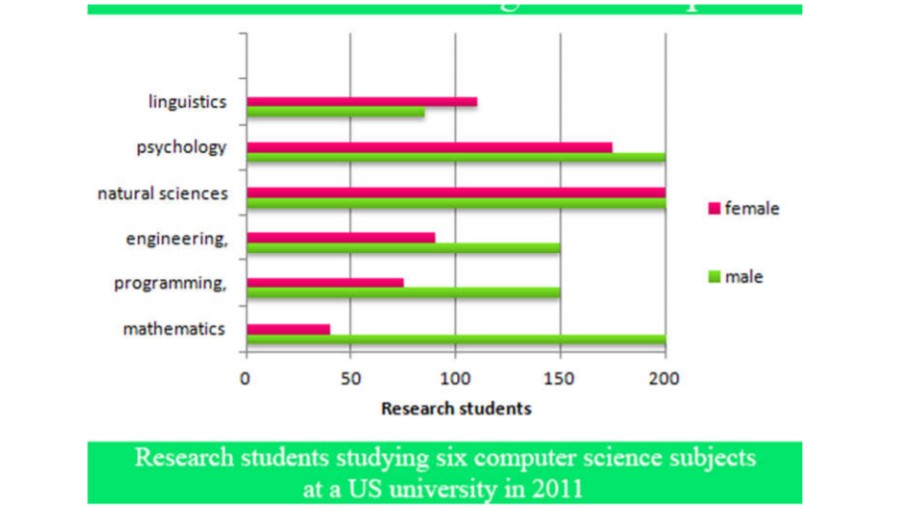
The given graph illustrates the number of research students enrolled in six different computer science subjects (linguistics, psychology, natural sciences, engineering, programming and mathematics) at a university in the US in the year 2011, based on their gender.
Overall, the total number of female students studying computer science is fewer than male students. Out of six subjects, only in linguistics, the female students exceed the number of males. In natural sciences, the number of male and female students is equal, while male students’ remaining four subjects are higher than female students. The number of female students studying engineering, programming and mathematics is very less which is the same as male studying linguistics.
Firstly, the male research students with 200 of them studying mathematics are more than four times that of their female counterparts with less than 50. Similarly, the number of female students attending engineering and programming with less than 100 each is less than the number of male students studying the same subjects, exactly 150 each. Also, there are less female than male studying psychology.
However, the number of male and female students studying natural sciences is equal to 200 research students. Interestingly, the female students dominated the linguistics with more than 100 students and males with less than 100.
Discover more from IELTS Fever
Subscribe to get the latest posts sent to your email.


