
The chart below shows the changes in sales of four different types of books from 2002 to 2012. Summarise the information by selecting and reporting the main features and make comparisons where relevant.
 The bar chart illustrates the information related to the four categories of books (hobbies, entertainment, history, and art) sold between 2002 and 2012 over a decade. Units were measured in thousands.
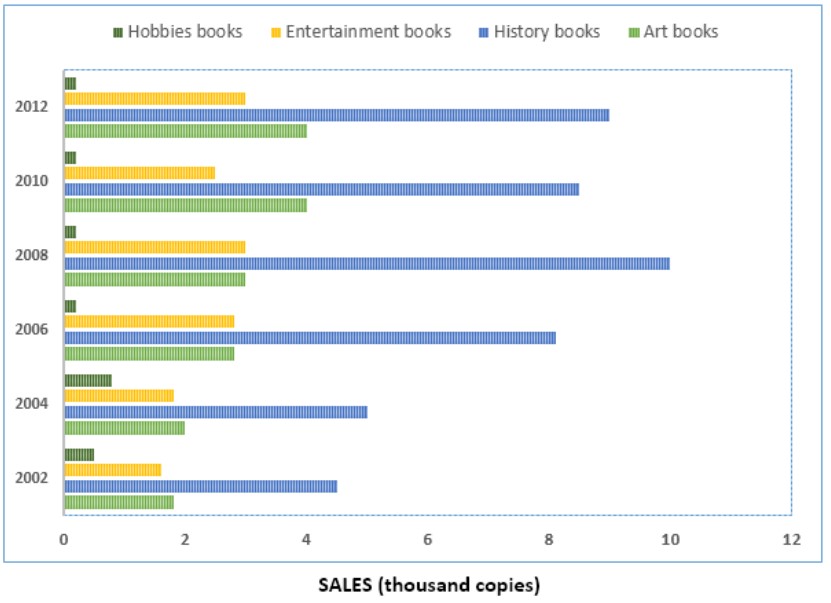
Overall, the bar graph reveals that history books were popular in all the given years, and people were least interested in hobby books.
At first, in 2002, more than four thousand history books were sold, which was more than double as compared to entertainment and art books, while only around 700 copies of hobby books were sold. In the following year, 2004, the numbers increased slightly, but in 2006, sales of history books went up significantly to 8 thousand copies. As for entertainment and art books, they sold the same number of copies, around 3000, whereas hobby books decreased their sales to only 250, which remained the same until the end of the year.
In 2008, the sales of history books peaked at ten thousand copies, and as for the other three, they only slightly went up. After the next two years, history and entertainment book sales declined to about 8100 and 2250, while art book sales increased to 4000 and remained the same in 2012. In 2012, history and entertainment book sales increased slightly by 300 copies.
Subscribe to Us On the IELTSFever YouTube channel For Tips And Tricks and Real Exam Tasks
Discover more from IELTS Fever
Subscribe to get the latest posts sent to your email.


