
The chart below shows the global sales ( in billions of dollars) of different kinds of digital games from 2000 to 2006. Summarise the information by selecting and reporting the main features, and make comparisons where relevant.
Sample Answer of The Chart Below Shows the Global Sales AC Writing
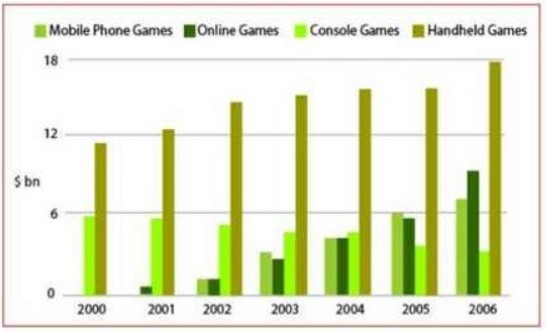
The given bar charts demonstrate the four different types of games, mobile phone games, online games, console games and handheld games global sales between 2000 to 2006. Sales measured unit was a billion-dollar.
Overall, handle games sailing was highest throughout the three games, console games sales were fallen year by year in contradictory, mobile and online games sales rose moderately.
For handheld games, sailing was 10 billion dollars in 2000, which jumped slowly and in 2003 it was 14
billions dollar. In 2004 and 2005 sales amount was the same, 15 billion dollars, which increased 4 billion
dollars after one year, which was also the highest amount. For console games, 5 billion dollars were sold items rates in 2000, after that year demand of this games was overcome, 5 billion profit in 2003 and 2004, it continued to drop and stood at 3 billion dollars at 2006.
For mobile phone games, sales for these games was not started a couple of years, in 2002 only 1 billion the dollar had worldwide sales, the demand for these games was rose moderately, and in 2006 it touches the zenith of it on account of 7 billion dollars. For online games, starting year sales was not discovered in these charts after that year a half billions dollar was sailing, it grew and in sales amount was likely the same as mobile phone and console games in 2004, people perchance it game hence it sky up and reach its highest point in 2006 at above 8 billion dollars.
Discover more from IELTS Fever
Subscribe to get the latest posts sent to your email.


