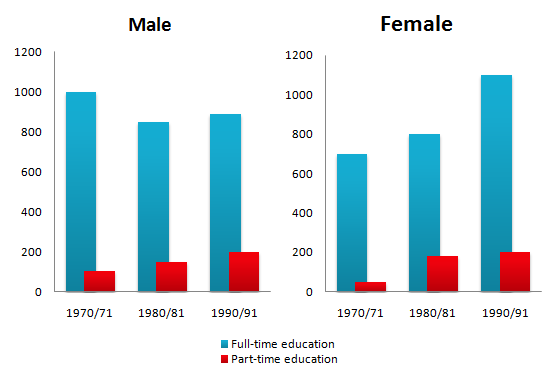
The chart below shows the number of men and women in further education in Britain in three periods and whether they were studying full-time or part-time. Summarise the information by selecting and reporting the main features, and make comparisons where relevant.
The bar graph illustrates the total number of males and females in the United Kingdom who were pursuing their further study in consideration of both part-time and full-time education for three given years commencing from 1970/71. The data was measured in numbers and taken after every decade till 1990.
It is conspicuous from the provided male chart that numbers of participation have fluctuated in full-time education; on the other hand, numbers gradually increased but marginally decreased in part-time education. It is readily apparent from the given female chart that the number of students in both categories were graduated incline forgiven three years.
Explicitly, the men were almost 1000 numbers in the full-time study while they almost ten-time dip side in part-time education for a particular year 1970\71. Furthermore, males were just above 800 nos. And little less than 200 nos. For years of 1980/81 and 1990/91 respectively.
On further scrutiny, females were impressive in full-time and part-time studies in 1970/71. They depicted 700 nos. in 1970/71, Which skyrocketed to 100 nos. And 500 nos. More after every decade for full-time education. Moving further, part-time education in women’s division was observed in the region of 50 to 200 nos, for all three provided years.
Follow Us on IELTSFever Twitter for more updates
Discover more from IELTS Fever
Subscribe to get the latest posts sent to your email.