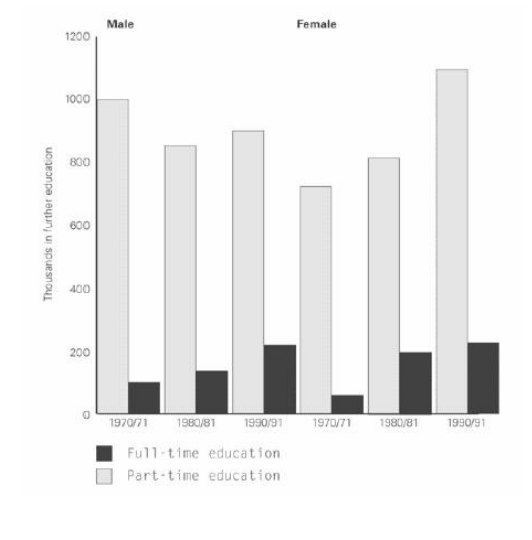
The chart below shows the number of men and women in further education in Britain in three periods and whether they were studying full-time or part-time.
Summarise the information by selecting and report in the main features, and make comparisons where relevant.
Write at least 150 words
sample answer:
INTRODUCTION:
The bar chart represents the information about the number of males and females in full-time and part-time education in Britain from the year 1970 to 1991.
PARAGRAPH !:
It is evident from the bar graph that the number of men was 1000 thousand in part-time education in the year 1970, which decreased to 850 thousand in 1980. In 1990, 900 thousand males were studied part-time education in Britain. The number of men who study full-time education in Britain was 100 thousand in 1971, whereas this number increased to 200 thousand until the year 1991.
PARAGRAPH 2:
It is further clarified from the bar graph that the number of females who study part-time education was 750 thousand in the year 1970, whereas this number increased to 800 thousand in 1980, while rose to 1100 thousand in the year 1990. Furthermore, in the year 1971, 50 thousand women participate in full-time education, whereas this figure increased by 200 thousand in 1981. 250 thousand females were studied full-time education in the year 1991.
CONCLUSION:
Overall, the maximum number of males and females who study part-time education from the year 1970 to 1991 in Britain.
sample answer 2:
INTRODUCTION:
CONCLUSION:
PARAGRAPH 1:
PARAGRAPH 2:
this is the end of academic writing task 1( The chart below shows the number of men and women in further education in Britain in three periods and whether they were studying full-time or part-time.)
Discover more from IELTS Fever
Subscribe to get the latest posts sent to your email.