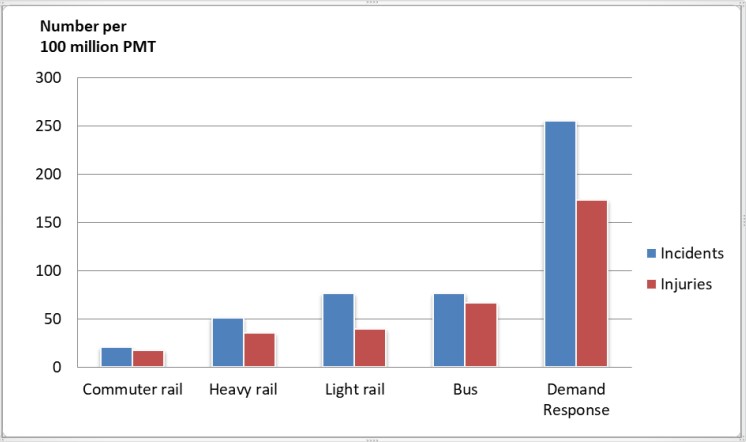
The Chart Below Shows the Numbers of Incidents and Injuries per 100 Million Passenger Miles Traveled
As shown in the graph below, in 2002, the data of commuters using the demand response transportation service gained higher numbers in experiencing incidents and injuries compared to other modes of transportation.
As per data gathered regarding incidents and injuries, it can be reflected that commuter rail and heavy rail are both less likely to experience any of the abovementioned incidents. These modes of transportation are timed, well-manned, and monitored by the state and local government.
This includes checking people entering and exiting, scanning their personal belongings, and asking for identification information in cases where authorities find someone suspicious. Additionally, operations can be seized if any issues arise that may put the safety of passengers at risk.
Compared to DRT, which is mostly more personal, you can’t thoroughly screen both the consumer and the provider daily.
DRT is more flexible convenience-wise, but some consequences can be met. Furthermore, DRT providers can be called upon to take necessary measures and plans of action if we consider the data.
Hence, injuries are more preventable in commuter and heavy rail as they cater to more passengers. Safety and other measures are being implemented accordingly, which keeps everyone’s safety intact daily.
Follow Us on the IELTSFever Facebook Page For More Updates
Discover more from IELTS Fever
Subscribe to get the latest posts sent to your email.


Very satisfied