
The chart below shows the percentage of female members of parliament in 5 European countries from 2000 to 2012. Summarize the information by selecting and reporting the main features, and making comparisons where relevant.
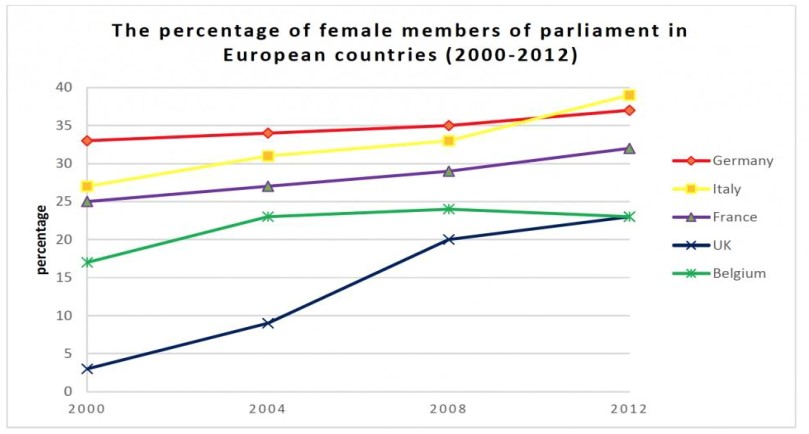
The chart compares the percentage of women who were a member of assembly in several 5 European nations over 12 years from 2000 to 2012
Overall, the graph indicates that the proportion of female candidates in a parliament fell in Belgium while it doubled in the UK with both rates finally 23%.
In detail, the percentage of women who were a member of Parliament in the UK began at 0.5% in 2000, while it was actually at nadir, and it rose fairly steadily until around 2012 when it reached about 23%. After this, the situation in Belgium was almost the reverse of this in 2012, the female groups of Parliament shot up sharply from 12% to 25% approximately, which amounts to a rise of 13% over a very short time of period eight years, but this number declined by 2% after four years.
Although, the female candidates were interested in Parliament in the rest three-nation and continued to increase with this pace and steadily surged up in Germany in 2000, when it was 34% in 2000 and skyrocketed over the years, climbing by 3% after 12 years from 2000 to 2012, even though, female workers of Parliament in Italy and France had started the trend of inclination almost together with shares at nearby 25% in 2000. It is interesting to note that the proportion of female members in Parliament in Italy hit its peak at approximately 40% in 2012. Whereas, the same trend was noticed in France with shares inclined at about 30%.
Follow Us on IELTSFever Twitter for more updates
Discover more from IELTS Fever
Subscribe to get the latest posts sent to your email.


