The chart below shows the percentage of water used for different purposes in six areas of the world. Summarise the information by selecting and reporting the main features, and make comparisons where relevant.
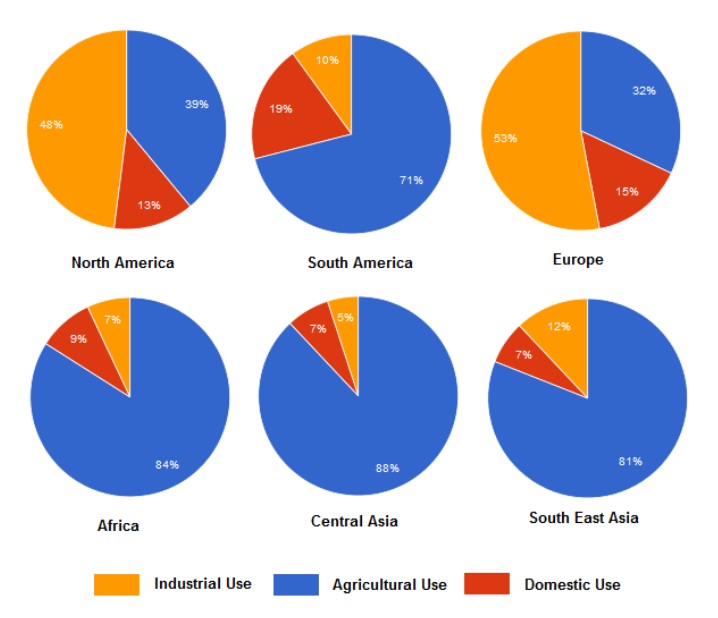
The Bar charts illustrate water usage in percentage for various needs in six different areas worldwide. Mainly, water is used in three categories: industrial, Agricultural and domestic.
Overall, among the various categories, the highest percentage of water used is for Agricultural and farming needs in the world, and the minuscule percentage used is for Domestic reasons.
In North America, 48% of water is necessary for the Industrial segment, 39% is used for agricultural use, and the remaining 13% is used for domestic requirements. Whereas in South America, the highest with 71% of water, is needed for agriculture and with 19% for domestic purposes and with Lowest per cent with 10%, for industrial usage. However, Europe is using the highest percentage of water for Industrial needs and 32% for the Agricultural group and only 15% for domestic purposes.
In the remaining countries such as Africa, Central Asia and South East Asia, the highest percentage of water is required for Agricultural basis at 88%, whereas for domestic needs only 7 to 9 per cent of water is used and for industrial usage, the water used is 5 to 12 percentage approximately.
Follow Us on IELTSFever Twitter for more updates
Discover more from IELTS Fever
Subscribe to get the latest posts sent to your email.


