The chart below shows the results of a survey about people’s coffee and tea buying and drinking habits in five Australian cities. Summarise the information by selecting and reporting the main features, and make comparisons where relevant.
 Sample Answer: The Chart Below Shows the Results of A Survey About People’s Coffee and Tea Buying and Drinking Habits in Five Australian Cities
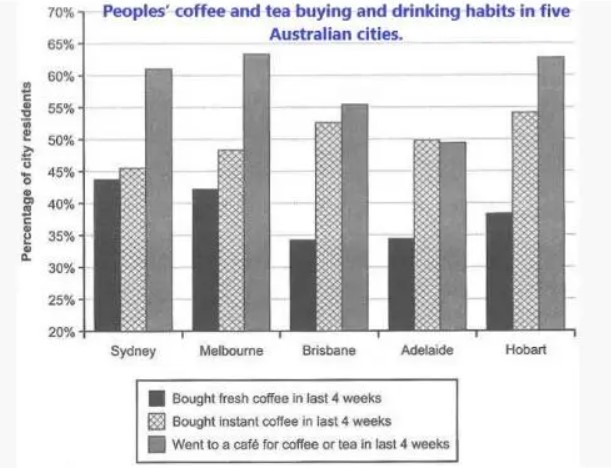
The bar chart shows the varieties of tea consumed and their drinking patterns in five cities in Australia: Sydney, Melbourne, Brisbane, Adelaide, and Hobart.
Overall, it is clear that consumers who went to a cafe for coffee or tea in the last 4 weeks in Melbourne city had the highest. Consumers in Hobart city and Sydney who went to a cafe for coffee or tea in the last 4 weeks are next to Melbourne, respectively. The least that went for coffee and tea in the last 4 weeks are consumers from Adelaide city.
It is also clear that there is a steady increase in Sydney, Melbourne, and Brisbane, with a slight drop and fluctuation in Adelaide, followed by an increase in Hobart, making Hobart the city with the highest number of consumers who bought instant coffee in the last month.
Furthermore, consumers who bought fresh coffee last month in Brisbane and Adelaide are the same, with the highest number from Sydney city. The city of Melbourne has the highest number of consumers who went for coffee and tea in the last 4 weeks, with 64 per cent; next is Hobart with 63 per cent, while Sydney, Brisbane and Adelaide are 61, 55, and 49 per cent, respectively.
To sum it up, consumers who went to a cafe for coffee and tea across all cities had the highest per cent, while consumers who bought fresh coffee in the last month across all five cities had the lowest per cent.
Follow us on IELTSFever Facebook Page for more updates and latest News about Immigration
Discover more from IELTS Fever
Subscribe to get the latest posts sent to your email.


