


The Chart Below Shows the Total Number of Minutes (in Billions) of Telephone Calls in The Uk, Divided Into Three Categories, from 1995 to 2002. Summarise the Information by Selecting a Reporting of The Main Features and Make Comparisons Where Relevant.
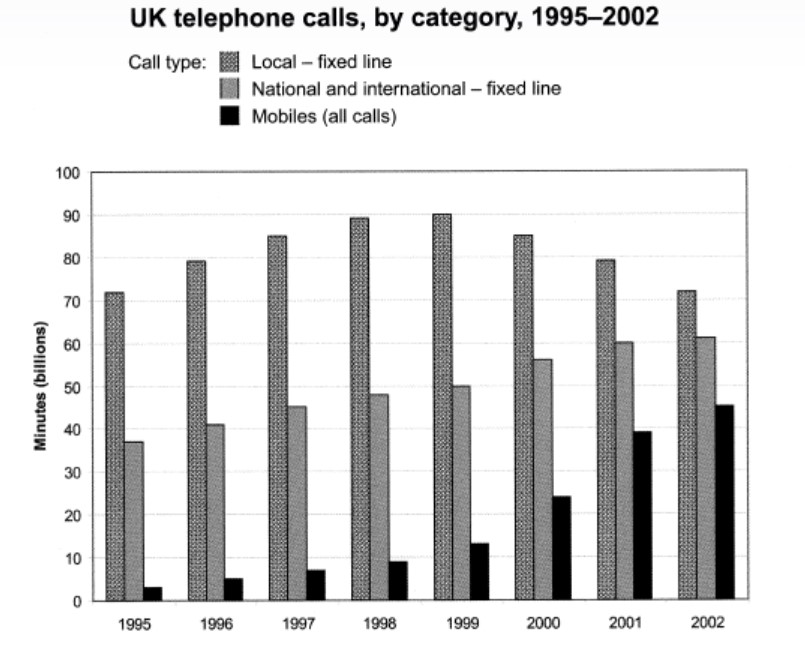

📊 The bar graph demonstrates the total number of minutes (in billions) of telephone calls in the United Kingdom, separated into three groups, over the eight years between 1995 and 2002.
🔍 Overall, both national and international 📞, and mobile calls 📱 rose in direct proportion to time. On the other hand, local calls 🏠 increased in the first four years and then started to decline, eventually returning to their original numbers. However, local calls remained the most popular and widely used method of making calls in the UK, while mobile calls were the least used.
📈 Initially, local calls 🏠 accounted for almost 70 billion minutes in 1995. Despite peaking in 1999 at 90 billion minutes, this category experienced only a negligible increase from 1995 to 1999, followed by a gradual decline from 1999 to 2002.
🌍📞 National and international calls rose steadily from approximately 35 billion minutes in 1995 to 48 billion minutes by 1998. During the same period, mobile calls 📱 were the least preferred method, starting at under 5 billion minutes in 1995 and increasing slightly to less than 10 billion minutes in 1998.
📉 After 1999, local calls 🏠 began a slight descent, eventually reaching the same level as in 1995. Meanwhile, national and international calls 🌍📞 climbed gradually, showing a total increase of around 25 billion minutes by the end of the period.
🚀 The most significant growth occurred in mobile calls 📱 between 1999 and 2002, which surged dramatically to reach a peak of approximately 45 billion minutes by the end of the period.
Follow us on Facebook IELTSFever Page For more Updates