


The bar chart below shows the total number of minutes (in billions) of telephone calls in Australia, divided into three categories, from 2001- 2008. Summarise the information by selecting and reporting the main features and make comparisons where relevant. Write at least 150 words
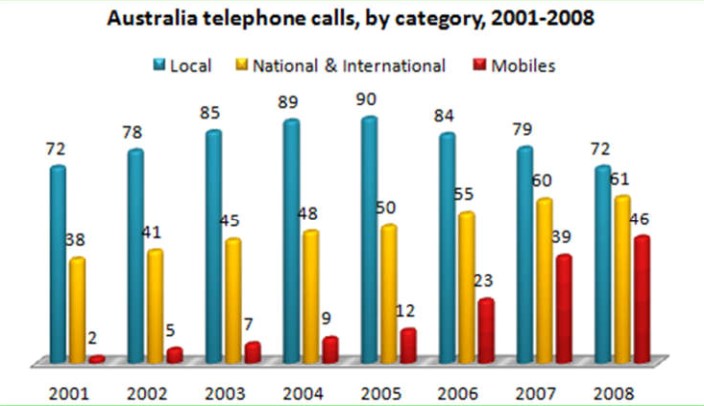

The provided bar charts illustrate the three different types of telephone calls, local, national and international and mobile call in Australia between 2001 to 2008, calls measured unit was minutes and it is given in billions.
Overall, year by year national and international and mobile calls used was rose, the most used call was local which was fallen after half period. Dramatically revolution in mobile telephone calls minutes.
In 2001, 72 billion telephone minutes was for local call whereas 38 billion minutes were for national and international telephone calls, mobiles call was not popular that times, it was on starting phase with 2 billion cells. All three types of call usage jumped up slightly. After 4 years, we can clearly see 10 billion minutes incensement in mobiles, 12 billion and 18 billion minutes in local and national and international calls respectively.
After 2005, the local call was drop slowly and remained the same as starting the year on account of 72 billion call minutes, while dramatically growth in mobiles, nearly 12 billion minutes added per year, in 2098 it had only 15 billion fewer minutes than national and international minuets in Australia. Call of national and international was growing continues and stood at 61 billion minutes in 2008, it had roughly 20 billion minutes incensement.