The chart shows the employment status of adults in the US in 2003 and 2013. Summarise the information by selecting and reporting the main features, and make comparisons where relevant.
The chart shows the employment status of adults in the US in 2003 and 2013. Summarise the information by selecting and reporting the main features, and make comparisons where relevant.
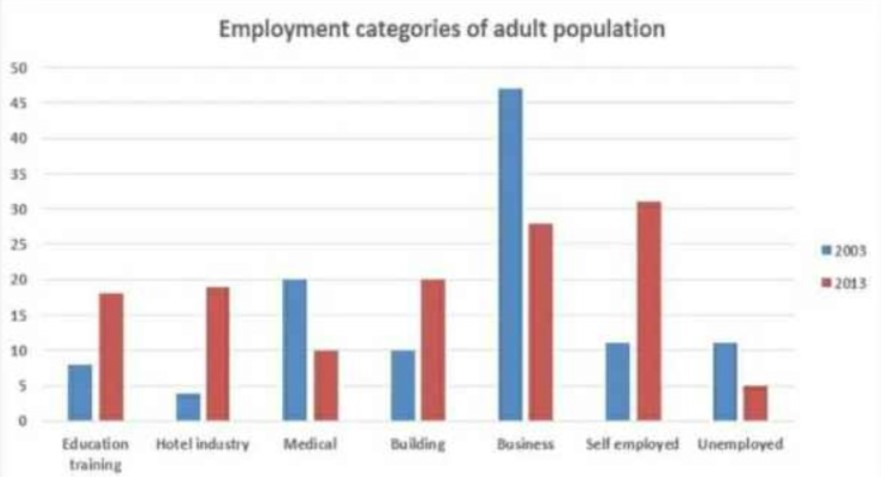
The bar chart provides us with common information about the occupation situation in the United States of America in 2003 and 2013 years.
Overall, we see that the total percentage of employees increased in 2013. For instance, the number of unemployed people was considerably bigger ten years ago- almost 5 per cent of all citizens were sitting without any occupation.
Talking about separate fields of activities, the data illustrate a rising number of people’s interest in the recreation and hotel industry. We see that more than 15 per cent of those working in the US decided carrier in this sector in 2013, opposite to less than 5 per cent in 2003.
However, at the same time, kinds of businesses lost those attractions in the eyes of entrepreneurs because the general number of businessmen strongly decreased from more than 45 per cent to around 25 per cent.
In addition, people decided to work for themselves because the bar shows data that around 1/3 of a common number of occupation persons were self-employed in 2013, down from almost 10 per cent in 2003.
Follow Us on IELTSFever Twitter for more updates
Discover more from IELTS Fever
Subscribe to get the latest posts sent to your email.