
The Charts Below Show Changes in the Proportion of Energy Produced From Different Resources in a Country in 1985 and 2003. Summarise the Information by Selecting and Reporting the Main Features, and Make Comparisons Where Relevant.
 Sample 1: The Charts Below Show Changes in the Proportion of Energy Produced From Different Resources in a Country in 1985 and 2003
The two pie charts illustrate how the sources of energy production in a specific country changed between 1985 and 2003. It is evident that while some energy resources maintained their importance, others experienced significant shifts over the 18-year period.
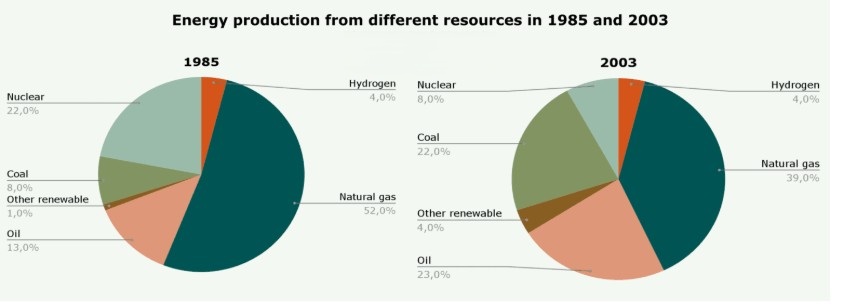
In 1985, natural gas was the dominant energy source, contributing 52% to total production. This was followed by nuclear energy at 22% and oil at 13%. Coal accounted for a modest 8%, while hydrogen and other renewable resources represented the smallest shares at 4% and 1%, respectively.
By 2003, the energy mix had become more diversified. Natural gas, though still the largest contributor, declined to 39%, marking a notable drop of 13 percentage points. Conversely, oil usage rose considerably to 23%, becoming the second largest energy source. Coal also saw a substantial increase, doubling from 8% to 22%, matching nuclear energy, which halved its share from 22% to 8%. Other renewable sources grew from a marginal 1% to 4%, and hydrogen remained stable at 4%.
Overall, the data shows a shift away from a heavy reliance on natural gas towards a more balanced distribution among coal, oil, and renewables. The decreased use of nuclear power and increased contribution of environmentally friendly sources may suggest growing concerns about safety and sustainability in the energy sector.
Sample 2: The Charts Below Show Changes in the Proportion of Energy Produced From Different Resources in a Country in 1985 and 2003
The pie charts compare the proportion of energy produced from six different sources in one country in the years 1985 and 2003. While natural gas remained the leading energy source, notable changes occurred in the contributions of other resources.
In 1985, over half of the country’s energy (52%) came from natural gas, making it the most significant source by far. Nuclear power was the second largest contributor at 22%, followed by oil at 13% and coal at 8%. Hydrogen accounted for 4% and other renewables made up just 1%.
By 2003, natural gas had decreased to 39%, although it continued to lead. Oil production increased by 10 percentage points, reaching 23%, while coal also rose sharply to 22%. Nuclear power dropped substantially to 8%. Meanwhile, other renewable sources grew slightly to 4%, and hydrogen remained constant at 4%.
In summary, the energy profile of the country became more evenly distributed by 2003. Although natural gas still provided the most energy, other sources like oil, coal, and renewables gained importance, possibly reflecting changing energy policies and environmental priorities.
Follow Us on The IELTSFever Facebook Page for more updates
Discover more from IELTS Fever
Subscribe to get the latest posts sent to your email.


