The charts summarise the weight measurements of people living in Charlestown in 1955 and 2015.
Summarise the information by selecting and reporting the main features, and make comparisons where relevant.
Write at least 150
sample answer :
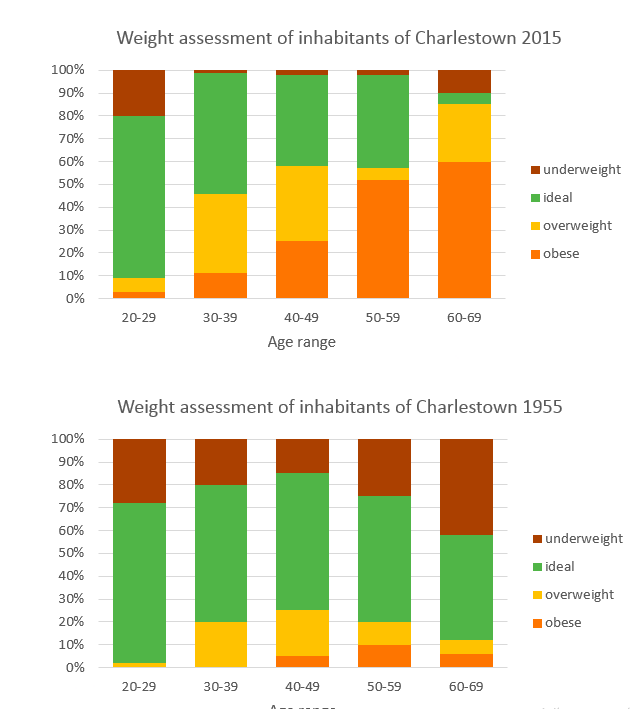
The bar charts show the difference weight categories of dwellers of Charlestown over a period of 70 years.
From an overall perspective, it can be seen from the charts, in 1955, most of the people of Charlestown had ideal weight in every age group. On the other hand, people had become more obese in the year 2015.
At the first glance, in 2015 , in the age of 20-29, people who had ideal weight at 70% as same in 1955; however, around 2% of people became obese in that age group in 2015. In age between 30-39, almost 60% of citizens had ideal weight in 1955, and it declined slightly to 50% in 2015. Moreover, in the same age group, under weighted people were at 20%, but it fell down dramatically at almost 2% in 2015. With regards to obese, it started to grow in 20-29 age, and gradually increased in that figure with respect to growing age of citizens in the year 2015, while in 1955, the figure of obese was negligible as compared to in 2015.
Moving on further, the percentage of overweighted people was approximately 34% for 30-39 age range, almost 23% in 40-49 and around 38% by elderly people in the year 2015. In contrast, it was at around 20% for 30-39 and 40-49 age group in 1955. In 2015, almost half of the inhabitants of Charlestown were obese, and around one-third of people were overweighted, also one-fifth were under-weighted, while only 5% was obese and majority of citizens had ideal weight and almost 60% were under-weighted.
this is end of academic writing task 1(the charts summarise the weight measurements of people living in Charlestown in 1955 and 2015.)
Discover more from IELTS Fever
Subscribe to get the latest posts sent to your email.


