


The Graph below shows the cinema attendance in Australia and the average cinema visits of different age groups from 1996 to 2000. Summarize the information by selecting and reporting the main features, and make comparisons where relevant.
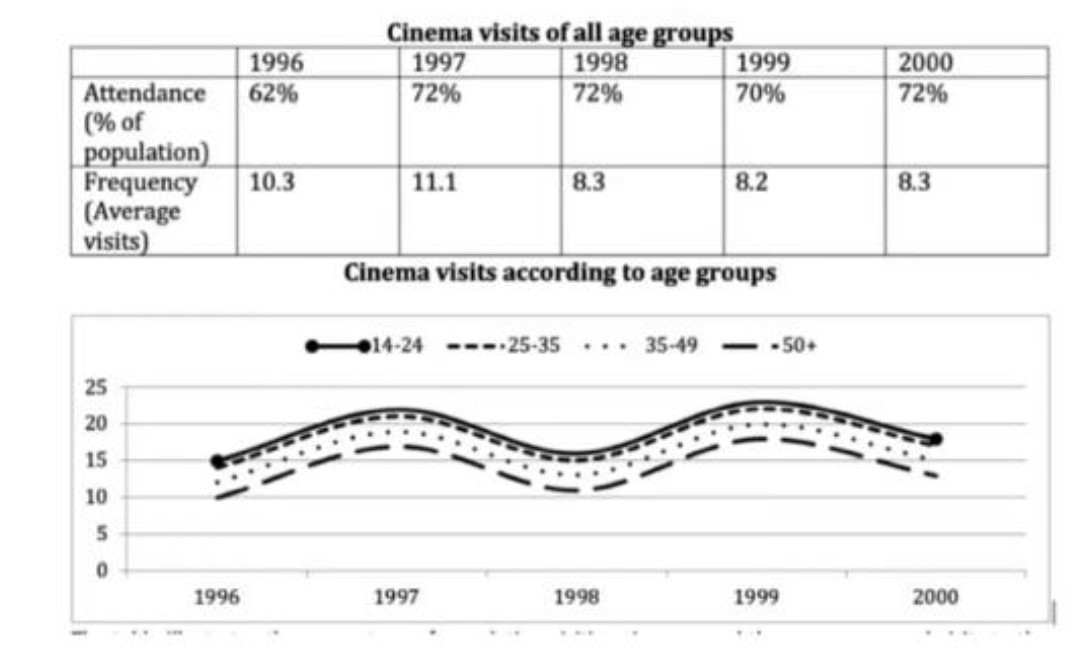

The table below illustrates cinema attendance and line charts demonstrating age-wise average sightseers in Australia between 1996 and 2000.
Overall, it can be seen that with increasing age and year visitors number also rose.
In 1996, attendance was 62%, while the average number of visitors was 10.3. Later population percentage was same except in 1999 that time had 2% less than in 2000. With the peak frequency, 1997 had 11.1 average visited, next three years, this number was roughly the same.
For 14 to 35 ager, in 1996 holidaymakers average was 15 which remained same in 2000, between the period the peak was 22 in 1997 and 1999. For 35 to 49 age groups, 12 was in starting year which was passed with the same distance from above-mentioned groups and with 3 increased in 2000 was 15. For 50 plus ager, through the period this category people watch the least movie or show in the cinema, 10 was in 1996 which rose and a year later had same as 14 to 24 group had in 1996 after slightly fluctuation was 12 in 2000.
Follow Us on IELTSFever Instagram for more updates and the latest test tasks.
Also, Read The Pie Chart Below Shows Energy Is Used in a Typical Australian