
The graph below gives information about internet users in three countries between 1999 and 2009. Write a report for a university lecturer describing the information shown below. Make comparisons where relevant.
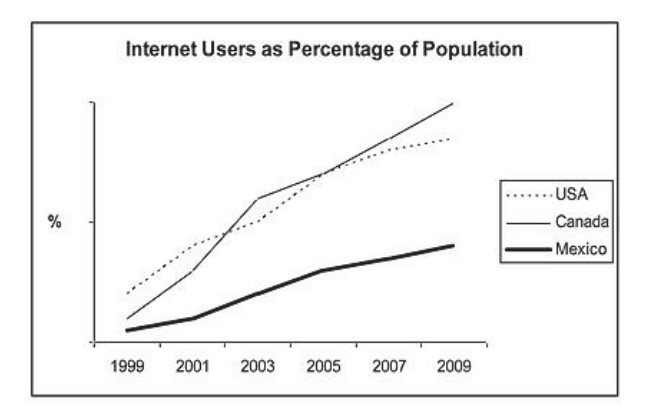
The line graph depicts the number of customers who used the internet in the USA, Canada, and Mexico between 1999 and 2009. It can be seen that there was an increase in usage of the internet in all three countries with each passing year.
Canada had a maximum increase in internet users over the whole period. In 1999, It was the second highest country as compared to the USA, which was the number 1 country in terms of Internet users. Both countries showed upward trends in each passing year, reaching the same level in 2005. After that year, Canada established the highest percentage of increase, and in 2009, it became the highest internet customers country.
As compared to the USA and Canada, Mexico had the lowest percentage of internet users in 1999. There was also an increase in internet consumption every year, but it was still the lowest users among all three countries.
Follow Us on IELTSFever Twitter for more updates
Discover more from IELTS Fever
Subscribe to get the latest posts sent to your email.


