The graph below shows how elderly people in the United States spent their free time between 1980 and 2010. Summarise the information by selecting and reporting the main features, and make comparisons where relevant.
The graph represents the spending of free time of elderly people in the United States in the year of 1982 to 2010.
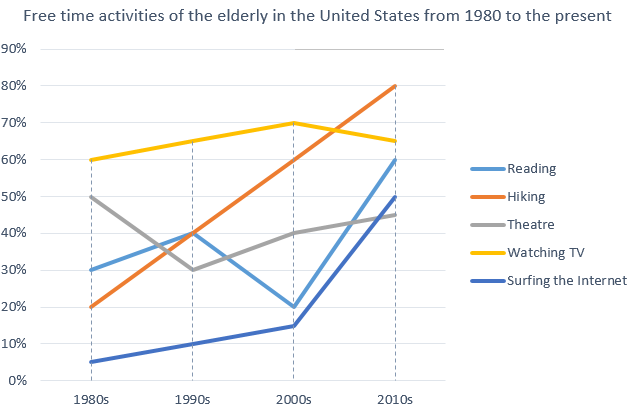
As it can be vividly seen that the senior citizen of the USA has a constant increase in hiking. Similarly, where the usage of the internet was not that popular but accelerated at an astonishing speed later. The percentage of theatre and reading activities have many swings in entire duration; in the beginning, the theatre was more favored by aged people than reading. However, in the end, reading outruns the theatre activity. Watching TV has been the most liked in the beginning 8 faced a downfall at the end but only outran by hacking.
According to the given data, at the beginning of 1980s, the theatre was the second most popular activity for leisure time with 50%, then it constantly decreased and reached 30% in 1990s, with an increase of 10% it reached to 40% in 2000s. By the 2010s, it almost gets to 45%. Whereas in case of reading it started with 30% popularity in the 1980s and continuously increased to get to 40% in 1990s. However, it hit the lowest point of 20% in the 2000s from where it gained the liking of the older generation and outrun the theatre activity by reaching 60% in 2010s.
Moving further to the remaining data, the most favored activity was watching TV with 60%, and the least liked was internet surfing with almost 5% in the 1980s. In the 2000s, both watching TV and surfing the internet gained liking by 10% each. Nevertheless, in the end, internet surfing gained popularity by reaching the peak of 50%, whereas there was a decline in watching TV by almost 5%. Percentage inactivity of hiking from 20 % in the 1980s constantly increase by 60% in 2010s.
Discover more from IELTS Fever
Subscribe to get the latest posts sent to your email.


